1 / 10

G-Band Images from MHD Convection Simulations

G-Band Images from MHD Convection Simulations. Robert Stein - Mich. State Univ. Mats Carlsson - Oslo Univ. Aake Nordlund - NBIfAFG Goran Scharmer - Roy. Swedish Acad. Sci. G-Band Spectrum. G-band image & magnetic field contours (-.3,1,2 kG).

alijah
Download Presentation

G-Band Images from MHD Convection Simulations

An Image/Link below is provided (as is) to download presentation Download Policy: Content on the Website is provided to you AS IS for your information and personal use and may not be sold / licensed / shared on other websites without getting consent from its author. Content is provided to you AS IS for your information and personal use only. Download presentation by click this link. While downloading, if for some reason you are not able to download a presentation, the publisher may have deleted the file from their server. During download, if you can't get a presentation, the file might be deleted by the publisher.

E N D

Presentation Transcript


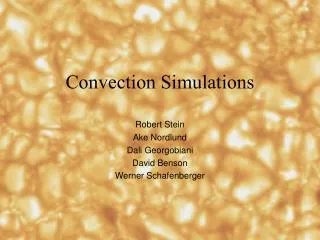
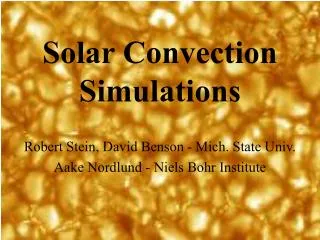
  1. G-Band Images from MHD Convection Simulations Robert Stein - Mich. State Univ. Mats Carlsson - Oslo Univ. Aake Nordlund - NBIfAFG Goran Scharmer - Roy. Swedish Acad. Sci.

  2. G-Band Spectrum

  3. G-band image & magnetic field contours (-.3,1,2 kG)

  4. Magnetic concentrations: cool, low r,low opacity.Towards limb,radiation emerges from hot granulewalls behind.On optical depth scale,magneticconcentrations are hot, contrast increases with opacity

  5. Temperature structure: Granule (G) Intergranular lane (IG) G-band bright point (BP) Dark flux concentration (FC) *T=Tgband +T=Tgcont

  6. Striated Bright Walls Observed

  7. G-band image & magnetic field contours (-.3,1,2 kG)

  8. Dark striations: weaker B larger r see higher cooler layer

More Related