Download
1 / 12
120 likes | 215 Views
Analysis of UK Quoted Shares by Value. 2 October 2013. Louise Rutter Manager, Equiniti Investor Analytics +44 (0) 20 74 691 883 louise.rutter@equiniti.com. Jason Black Head of Operations, Europe +44 (0) 20 77 767 574 black@orientcap.com. Agenda. About Equiniti & Orient Capital (OC)

E N D
Analysis of UK Quoted Shares by Value 2 October 2013 Louise RutterManager, Equiniti Investor Analytics +44 (0) 20 74 691 883 louise.rutter@equiniti.com Jason Black Head of Operations, Europe +44 (0) 20 77 767 574 black@orientcap.com
Agenda • About Equiniti & Orient Capital (OC) • Methodology • Company Support • Classification • Results • Recommendations
About Equiniti & Orient Capital • Equiniti are specialists in Share Registration and Registrar to 50% FTSE 100 & 35% FTSE 250 • Equiniti appointed by ONS to provide analysis of pooled nominee shareholdings for 2010 Ownership Survey • Orient Capital are largest provider of register analytics globally with expertise in equity market intelligence, proxy solicitation, investor communications and shareholder management technology • In 2012, Equiniti appointed Orient Capital as an outsourcing partner on behalf of its 140+ Investor Analytics Clients • Equiniti & Orient Capital jointly appointed by the ONS to provide analysis of nominee shareholdings as at 31 December 2012
Methodology • ONS provided Equiniti & OC with a sample of 200 UK companies • Suggestion to provide analysis on two data sets: • Pooled nominees in line with 2010 contribution • Full share register: certificated + CREST (pooled & non-pooled nominees) in line with recommendations of 2010 results • Pooled nominees: • Registered shareholders acting as custodians on behalf of multiple clients within each designated account • Results in multiple combinations of dynamic beneficial/investment manager shareholdings unique to each company • These are identified and tracked by the company or its appointed agent employing provisions in the Companies Act 2006 (‘Section 793’)
Methodology improvements • Sample increased from sub-set of FTSE100 companies to 200 across UK market • Provided full sector analysis for ‘Rest of World’ category • Thresholds not applied to identification of beneficial shareholders within pooled nominee holdings • Automated processing of data using OC’s advanced technology • Improved balance of industry group representation in sample • More extensive project commenced immediately after analysis date (31 Dec) and over a longer period than 2010 project (14 weeks vs. 9)
Sample company support • Strong sample group support for 2012 survey • Equiniti & OC analysed 67 companies of the 200 sample equating to over 50% of the sample group market cap • Analysis compiled using: • Register of Members (Share Register) • Register of Interests’ Disclosed (ROI/Section 808 Register) • Orient Capital’s proprietary beneficial shareholder database
Classification of beneficial owners • Cross-referenced and agreed with the ONS final list of Euroclear and Equiniti & OC defined pooled nominees • Beneficial shareholders identified within agreed pooled nominee accounts were classified as one of the following: • Rest of the world • Banks • Charities • Individuals • Insurance companies • Investment trusts • Other financial institutions • Pension funds • Private non-financial companies • Public sector • Unit trusts • ROW sector of ben owner: • Banks • Charities • Individuals • Insurance companies • Investment trusts • Other financial institutions • Pension funds • Private non-financial companies • Public sector • Unit trusts • ROW region: • Europe • Offshore UK • North America • Asia • Africa • Australasia and Oceania • Middle East • South/Central America • and the Caribbean
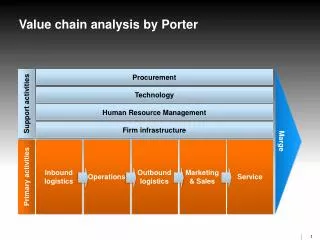
Classification of companies • Companies assigned to industry group: • Financial / Manufacturing / Non-Manufacturing • Companies assigned to FTSE sector weightings: • Financials • Oil & Gas • Consumer goods • Basic Materials • Consumer Services • Industrials • Health Care • Telecommunications • Utilities • Technology
Results • Equiniti & OC provided analysis of shareholdings representing £767bn – 50.3% of total value of sample • Data for 67 companies was included in the final sample • Key result - assumptions for multiple ownership of shares for 2012: • Per cent of value Per cent of value pooled nominees full register • Rest of World 65.9 57.9 • Banks 0.7 0.9 • Charities 0.4 0.4 • Individuals 7.9 6.6 • Insurance Companies 3.5 4.0 • Investment Trusts 0.1 0.2 • Other Financial Institutions 0.5 4.8 • Pension Funds 5.8 8.1 • Private Non-Financial Companies 0.1 1.0 • Public Sector 0.1 1.8 • Unit Trusts 15.0 14.4
Coverage • An average of 90.7% of a company’s total market value analysed through full register analysis • Final industry sample weightings: • Weighting (%) Weighting (%) within sample within FTSE 350 • Financials 15.71 22.20 • Oil & Gas 15.84 16.37 • Consumer Goods 13.12 14.00 • Basic Materials 11.48 10.64 • Consumer Goods 10.98 9.66 • Industrials 4.12 8.79 • Health Care 13.49 7.08 • Telecommunications 11.07 5.78 • Utilities 2.70 3.99 • Technology 1.50 1.49
Additional reporting • Commentary accompanying various tables of results: • Comparison of 2012 results to 2010 • Factors contributing to more significant changes • Detail regarding classification descriptions • Analysis of ratio of shares held by individuals in certificated form for sample of FTSE100 companies also provided: • Per cent of value • UK individuals 90.1 • Rest of World individuals 9.9
Recommendations • Equiniti & Orient Capital’s recommendations for improvements to the methodology employed in future Share Ownership surveys include: • Commission only the analysis of all shareholdings on a company’s share register i.e. both pooled and ‘one-to-one’ nominee holdings in Euroclear, as well as certificated shareholdings • Aim to replicate even more closely equivalent FTSE sector weightings in the sample of companies analysed