Download

1 / 56
560 likes | 568 Views
Green Remediation: Opening the Door to Field Use Session B (Green Remediation Tools and Examples) December 16, 2008 Carlos Pachon U.S. EPA Superfund Program pachon.carlos@epa.gov. What is Green Remediation?.

E N D
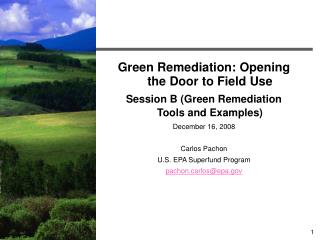
Green Remediation: Opening the Door to Field Use Session B (Green Remediation Tools and Examples) December 16, 2008 Carlos Pachon U.S. EPA Superfund Program pachon.carlos@epa.gov
What is Green Remediation? The practice of considering all environmental effects of a cleanup during each phase of the process, and incorporating strategies to maximize net environmental benefit of the cleanup. Focus is on remedy implementation vs. remedy selection
Is it Our Job? • Executive Order 13423, January 26, 2007-Strengthening Federal Environmental, Energy, and Transportation Management • Section 1. Policy. It is the policy of the United States that Federal agencies conduct their environmental, transportation, and energy-related activities under the law in support of their respective missions in an environmentally, economically and fiscally sound, integrated, continuously improving, efficient, and sustainable manner. • EPA Strategic Plan Goal 1: Clean Air and Global Climate Change • Protect and improve the air so it is healthy to breathe and risks to human health and the environment are reduced. Reduce greenhouse gas intensity by enhancing partnerships with businesses and other sectors. • EPA Strategic Plan Goal 5: Compliance and Environmental Stewardship • Stewards of the environment recycle wastes to the greatest extent possible, minimize or eliminate pollution at its source, conserve natural resources, and use energy efficiently to prevent harm to the environment or human health.
Opportunities to Increase Sustainability in Site Cleanups Apply to all cleanup programs Exist throughout site investigation, design, construction, operation, and monitoring Are aligned with our mandates (EPA Strategy, EO13423, etc).
Core Elements: Energy Requirements Energy efficient equipment operating at peak performance Periodic evaluation and optimization of equipment with high energy demand Renewable energy systems to replace or offset grid electricity Managed demand to leverage low peak capacity and rates
Carbon & Energy Footprints of Superfund Cleanup Technologies Total Estimated Energy Use in 2008-2030 (kWh*103) Estimated Energy Annual Average (kWh*103) Technology 489,607 92,919 18,679 10,156 6,734 618,095 11,260,969 2,137,126 429,625 233,599 154,890 14,216,209 Pump & Treat Thermal Desorption Multi-Phase Extraction Air Sparging Soil Vapor Extraction Technology Total Annual Carbon Footprint (MT CO2) Sum of 5 Technologies 404,411
Recap on Energy & Carbon Footprint Strategy Optimize systems to maximize efficiency and return per unit energy invested Build renewable energy capacity at contaminated sites to power remedies Tap into grid renewable energy portfolios Leverage carbon sequestration from soil amendment treatment (policy vacuum)
Green Remediation Profile: Ferdula Landfill, Frankfort NY Soil vapor extraction relying on wind power to draw vacuum from landfill vents Exclusively off-grid operations providing a pulsed effect for carbon removal of VOCs VOC concentrations in soil gas reduced over 90% in five years of operation
Green Remediation Profile: Operating Industries Landfill, Monterey Park CA Meets about 70% of plant needs (thermal oxidizer, refrigeration, and air blower) Six 70-kW microturbines for landfill gas collection (5,500 scfm) at Superfund site Savings reaching up to $400,000 each year through avoided grid electricity
Green Remediation Profile: St. Croix Alumina, St. Croix VI PV panels generating electricity for fluid-gathering system during oil recovery Wind-driven turbine compressors and electric generators powering pumps to recover free-product oil Reclaimed oil from RCRA site used for refinery feedstock
“OSWER” Green Remediation Strategy • Benchmark and document GR best management practices • Assemble a toolkit of enablers • Build networks of practitioners • Develop performance metrics and tracking mechanisms For the purpose of advancing green remediation best practices across cleanup programs OSWER seeks to:
Green Remediation Activities Existing Green remediation primer, website, and profiles of projects Internet seminars, and archived discussions (cluin.org) Tech support for Federal and State project managers Contracts toolkit for RACs Renewable energy fact sheets and website NARPM 8-hour training In the Pipeline MOU with NREL MOU with the USACE recognizing and fostering GR BMPs at Superfund cleanups Green Remediation Analyses and Development of Methodology (Region 9) Contracts toolkit for ERRS Remedy specific green remediation “cheat sheets’ Site cleanup energy audit tool Who’s who in green remediation (EPA Intranet) ER3 for green remediation OSC 4-hour training Engineering forum “GR review and technical support” capability Green cleanup voluntary standards project
Opportunities for a Standard • Growing interest in social responsibility • Companies have internal goals to become greener • New tools are being developed to evaluate impacts from cleanups • Builds upon state and local government incentives currently being developed • US Green Building Council has indicated interest in EPA developing green cleanup standard • Initiates a constructive dialogue
Conceptual Development for Green Cleanups Standard EPA initiates workgroup to develop Concept Paper for EPA management EPA Workgroup partners with ASTSWMO to develop straw metrics and incentives Standards Development EPA collaborates with Standard Developing Organization SDO Develops Green Cleanup Standard through Consensus Process Green Standard EPA/States Evaluate Standard and Develop Recognition Program(s) EPA/States Partners with Accrediting Organization(s) Self Declaration Conformity Assessment Submit documentation to cleanup program Certifying Organization(s) Recognized Compliance with Green Cleanup Standard 15
Key Attributes • Voluntary - Not mandating new cleanup evaluation • Transparent - Consensus based standards development • Universal - Easier for stakeholders to implement • Flexible - Program or State-specific recognition options • Minimal Resources - Independent 3rd party or self-certification (audits) • Market Driven - Certifying Projects or Persons (promote technology innovation)
EPA Green Remediation Primer Provides introduction to best practices with examples of how and where they are used Focuses on remedy implementation across regulatory frameworks Released April 2008, available at: http://cluin.org/greenremediation
Green Remediation on the Web www.clu-in.org/greenremediation
19 Green Remediation and TransportationClu-In SeminarDecember 16, 2008 Sean Sheldrake, EPA Region 10
Why Transportation? • Transportation is often the biggest energy consumer for site cleanups. • Transportation and other vehicles used can be the biggest polluters for each unit of energy required to do the cleanup at your site, increasing short term risks.
West Coast Collaborative Goals • Protect/Improve Public Health by: • Helping to meet National Ambient Air Quality Standards (PM2.5, Ozone) • Meeting air toxics goals (both federal and state/local partners) • Support Energy Security and Green House Gas Reductions by: • Using cleaner fuels (biodiesel, biogas/natural gas, electric …) relative to total diesel fuel • Advance regional/local production of renewable fuels supporting local agriculture and forestry sectors • Utilize SmartWay and other programs to virtually eliminate on-road, locomotive, and non-road HDD idling (ports, corridors, distribution locations)
Why is Reducing Emissions Important? Degrades Air Quality • Particulate Matter (PM) • Ozone precursors Energy and Climate Change • Over 40% of green house gas emissions from mobile sources • Over 90% of fuel imported petroleum Serious Health Effects • Diesel exhaust is a “likely human carcinogen” and respiratory irritant • Harmful diesel PM • Diesel exhaust contains “likely” and “known” (e.g., benzene) human carcinogens, and also have respiratory, neurological, developmental, and immunological health effects.
Particulate Matter (PM) In Diesel Exhaust Is The Driver Of Risk • Mix of particles and liquid droplets • Considerably smaller in size than human hair • Penetrates deeply into the lungs Hair cross section (70 mm) PM10 (10µm) PM2.5 (2.5 µm) Human Hair (70 µm diameter)
Avoiding Or Substantially Reducing Emissions • Switch from truck to rail transport • Investigate on-site disposal options • Integrate diesel emissions into short term impact analyses to allow for lower impact technology to be identified during FS analysis
What If Rail Transport Isn’t Practical? What Now? • Diesel emissions controls may be a viable and cost effective option at your site.
Diesel Oxidation Catalyst • Emissions Reductions • 20% - 50% reduction in PM • 60% - 90% reduction in HC • >90% reduction in CO
Diesel Particulate Filter Trapped PM Exhaust (CO2, H2O)Out Exhaust(PM, CO, HC)Enter • Emissions Reductions • 95% PM reduction • 90% HC reduction • 90% CO reduction Ceramic HoneycombWall
Diesel Particulate Filter Emissions Reductions 29 Typical test filter – no DPF Test filter – with DPF Unused test filter
30 Diesel Multistage Filter (DMFs)
Other Emissions Control Technologies & Cleaner Fuels • Selective Catalytic Reduction (SCRs) • 20% - 50% reduction in PM • 60% - 90% reduction in HC • >90% reduction in CO • 25% - 50% reduction in NOx • Biodiesel – Neet or blends (~$5/gallon - virgin biodiesel) • 10% to 50 % reduction in PM • Ultra Low Sulfur Diesel (ULSD)
Front Loader Hauler Dredging Earth Mover Back Hoe
Region 10 Success Stories • Emergency Response trucks now run on B100, where fill stations are available. • ERU trucks now also have DMFs installed to further improve tailpipe emissions. • ERRS contract now includes emission reduction language • Taylor Lumber, Sheridan OR • On the way—biodiesel usage in some MEL vehicles, Port of Portland Terminal 4 dredging with ULSD • Use of rail transport instead of trucks for soils disposal at Boomsnub removal site, Vancouver, WA • Sequential Biofuels
Seeking Partners • Steps involved for sites: • Inventory all energy needs at the site(s) • Energy requirements for any remediation systems, and new/existing buildings • Types of diesel construction equipment used/planned to be used, and when • Identify and implement appropriate technologies • Results from projects will help EPA develop the Smart Energy Resource Guide (SERG)
Mechanisms • Simple grant and cooperative agreement language • Simple contract/statement of work (SOW) language • Include language in AOCs, CDs, and RODs • Voluntary
Questions? Region 10:Sean Sheldrake – 206-553-1220Wayne Elson – 206-553-1463On the Web:Region 9:http://epa.gov/region09/cleanup-clean-air/index.htmlWest Coast Collaborative:http://www.westcoastcollaborative.org/
“Smart Energy Resources Guide” Michael D. Gill Region 9, San Francisco Green Remediation Seminar Series Session B December 16, 2008
Smart Energy Resources Guide • Outline for Today • History of Energy Activities in Region 9 • Document Overview • Next Steps
Smart Energy Resources Guide • History • Engineering Forum Issue Paper (May 2004) • Version 1 “Energy Calculator” (2005) • R9 Cleanup - Clean Air Initiative (2005) • RARE Project Awarded (2006) • R9 Energy Advisor Hired (2007) • SERG = RARE Product in (May 2008)
Smart Energy Resources Guide Electricity and Diesel Emissions Inventory • Footprint of half of R9 Superfund Sites • Total diesel emissions from 1985-2009 are estimated to be 3,140 tons NOx, 848 tons CO, and 105 tons PM. • ~ 54,000 buses driven across US • Total CO2 emissions associated with electricity consumption from 1990-2009 are estimated to be 428,174 tons. • ~ 84,000 cars on the road for one year or • ~ 50,000 single family homes for one year Dozer with diesel particulate filter
Smart Energy Resources Guide Renewable Energy Success Stories • Solar powered pumps, Apache Powder, AZ • Landfill methane gas, OII Landfill, CA • Solar powered water treatment units, LLNL Site 300, CA
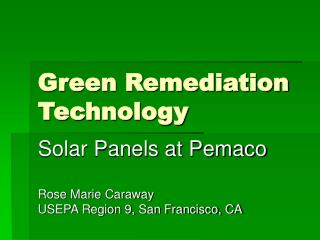
Smart Energy Resources Guide What the SERG Can Do For You: “The SERG provides information on practices and technologies that can reduce emissions from electricity and diesel use at cleanup sites.” Solar panels at Pemaco site, CA
Smart Energy Resources Guide What is Our Goal? Implement Renewable Energy • Reduce the significant, long-term energy demands typical for Superfund site cleanup operations • Reduce greenhouse gas emissions and air pollutants • Demonstrate progressive environmental leadership Reduce Diesel Emissions • Diesel exhaust contains harmful particulate matter (PM) • Diesel exhaust is a “likely human carcinogen” and respiratory irritant
Smart Energy Resources Guide • SERG Outline • Renewable Technologies (basics, assessments, costs, success stories) • Solar • Wind • Landfill Gas-to-Energy • Anaerobic Digestion • Biomass Gasification • Cleaner Diesel • Funding Resources and Opportunities LFG flares at OII site, CA
Smart Energy Resources Guide • SERG Outline (continued) • Tools – Calculators, References, Programs • Appendices • More on Technologies • Contract Language • Federal Regulations • Utility Programs Gasifier fueled with poultry waste, WV
Smart Energy Resources Guide Example of Chapter Detail • Solar Power • Solar Power Terminology • Technology Basics • Assessing Solar Power Potential and Size of a PV System • Grid-Tied or Stand-Alone System • Capital Cost, O&M, Installers and Warranties • Permits and Environmental Concerns • Success Stories
Smart Energy Resources Guide Example of Chapter Detail (cont) • Tools • Energy Efficiency Calculators • Purchasing Clean Energy Informational Resources • Renewable Energy Economic Calculators • Solar Power, Wind Power, etc. Tools