Download
1 / 37
390 likes | 551 Views
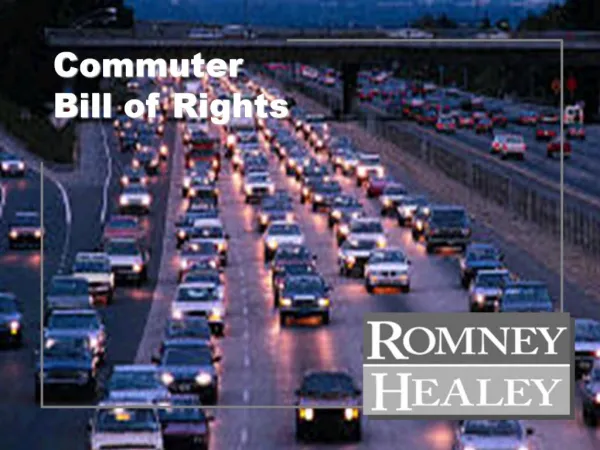
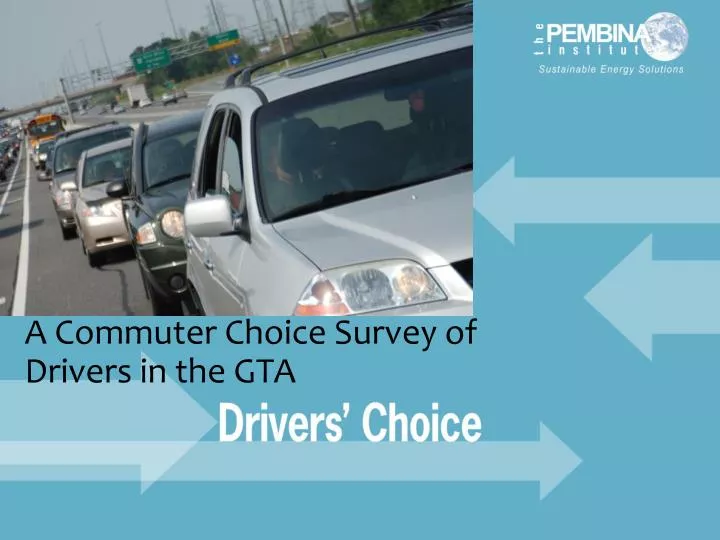
A Commuter Choice Survey of Drivers in the GTA. We surveyed…. 1000 Drivers Only in the GTA 30 minute minimum commute one way Mean one-way commute time – 43 min 84% take major highway 70% between 35-59 yrs of age. TOPLINE FINDINGS. Commuting by Car is Stressful.

E N D
We surveyed… • 1000 Drivers • Only in the GTA • 30 minute minimum commute one way • Mean one-way commute time – 43 min • 84% take major highway • 70% between 35-59 yrs of age
Commuting by Car is Stressful • 70% drive to work 5 days a week, and 2/3 experience some level of stress during their commute. • 2/3 say commuting takes away from quality of life in terms of family and personal time • Over half of drivers (56%) surveyed do not currently have access to a rapid transit alternative. • 1/3 have access to GO train and/or Subway
Reasons for not taking Rapid Transit • Takes too long • Too many transfers • Too far to access • Need car for errands along way • Don’t like it • Need car for my job
Rapid Transit Options • Education and information were built into the survey – We explained rapid transit options with pictures and descriptions…
Interest in taking Rapid Transit • Light rail transit (LRT): 69%40 + 29 • Subway: 68% 44 + 24 • GO train: 64% 35 + 29 • Rapid Bus: 55% 26 + 29 • Rapid Streetcar: 38%17 + 21 (very + somewhat interested)
There is a very high interest in alternatives to commuting five days a week by single occupancy vehicle Likely to take advantage of….
94% would be interested in telecommuting if offered by their employer. 2/3 would likely try “pay as you drive” auto insurance if it were available and of these,85% would change their commuting habits to find some other way to get to work if they had pay-as-you-drive insurance. 63%would be likely to trade their employee parking spot for cash and find another way to get to work if a parking cash-out program were available. Over 60% of drivers would consider carpooling if there were an added incentive to do so, such as flexible work hours or a financial incentive.
Revenue Tools The Greater Toronto Area has among the worst traffic congestion in North America, with one of the longest commute times. The next few questions are about ways to reduce congestion in the GTA, including: • finding ways to fund the building of new, more efficient rapid transit options, and • improving road and highway travel.
User vs. Society Pays • 63% of drivers surveyed supported user-based fees (transit fares, tolls, parking) to pay for transportation improvements as opposed to society-wide taxes (sales tax).
Drivers show moderate support for revenue tools to pay for transit expansion….
…with little variation in support between tools… How reasonable are revenue tools to raise funds for transit expansion/ transportation improvements • 58% thought tax on commercial parking lots was somewhat or very reasonable • 57% percent thought a toll was somewhat or very reasonable • 54% percent thought a 1% sales tax was somewhat or very reasonable
Revenue Tools (con’t) • 46% percent percent of drivers thought a regional gas tax increase of 2 cents to fund transit build in the region was somewhat or very reasonable • 54% percent of drivers who commute by major highway were likely to pay to use an optional express lane that would allow them to by-pass highway congestion (HOT lane)
…but show higher support if funds are fair, transparent and dedicated User fees are more acceptable if:
Transparency and dedication • 69% of drivers are more willing to pay a user fee if it was dedicated to building new rapid transit that connected their community with a broader rapid transit system in the GTA
Transparency and dedication • 69% would find a road toll more acceptable if they knew the funds were fully dedicated to building a rapid transit line close to this same route
Transparency and dedication • 70% would be more willing to pay a new user fee if they could see the results in the form of new transit built in the GTA
Fairness • As for those who support a user-based road toll, most (68%) thought it should only be charged only on routes where drivers currently have access to rapid transit alternatives • For those who don’t, 46% thought them to be more acceptable if they were only on routes where rapid transit alternatives exist.
Implementation and Acceptability • Stockholm: 30% support for road charging pre trial; 50% after trial; 70% after the reintroduction of the trial • Similar trend in Norway (toll) and London (cordon) • 40% supported BC’s carbon tax in 2008 before it was introduced; November 2011 support rose to all time high 57%
By Region • Toronto: 351 • Peel Region: 241 • Halton Region: 147 • York Region: 166 • Duram Region: 96
Conclusions • High interest in incentives and options • Not that much variation in support between pricing tools, but lowest support for gas tax • Higher support for user fees • Acceptability increases with dedication, transparency and fairness • Acceptability increases with implementation • Strong support for building transit • Education and understanding leads to greater acceptance
Policy Considerations • Not a matter of ‘if’ but when, where and how revenue tools are introduced; implement right and acceptability will follow • Consider combination of carrots and sticks; carrots can reduce congestion in the immediate term and sweeten the pot • High interest in PAYD worth considering a pilot • Education on the benefits is critical as well as clear understanding of the vision and transit technology • Dedication of revenue to transit expansion and benefits, with full transparency • Consider reframing how certain tools are named: regional gas tax vs. regional transit fee – and showing in real time where the funds are going/ getting close to the goal
Policy Considerations • Parking revenue tools are well supported, easy to implement and can happen without broad communications • Express lanes/HOT lanes could be piloted • Consider beginning with tolls or congestion charges along routes with available rapid transit • Ensure that tools are coordinated and collected strategically throughout the region and dedicated to priority projects eg: committing revenue to an expensive subway in low density area could preclude funding for more economically sound projects) • Education of society benefits society pays
Key Messages • Congestion is causing stress and drivers want options • High interest in alternatives and options • Moderate support for revenue tools – Over 50% of drivers receptive to most pricing options • High support among drivers for revenue tools if it is dedicated to building rapid transit in the region (connecting with a network). • Strong interest in mode shifting to rapid transit if it was available