Download
1 / 47
470 likes | 693 Views
LID Hydrology and Hydraulics. Doug Beyerlein, P.E. Clear Creek Solutions, Inc. www.clearcreeksolutions.com. LID Hydrology and Hydraulics Modeling. There is nothing magical about LIDs. Water must go somewhere. Water must either: Infiltrate into the soil.

E N D
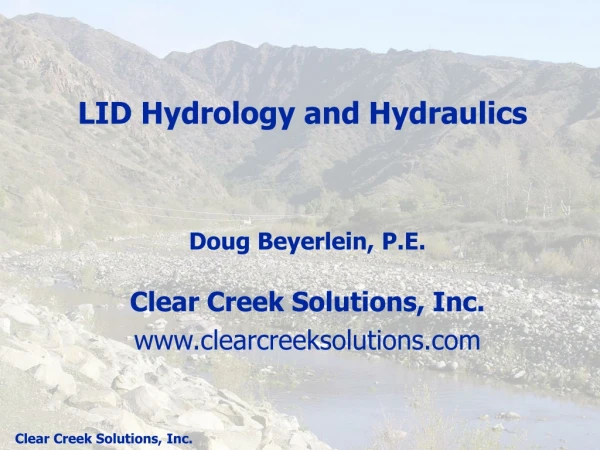
LID Hydrology and Hydraulics Doug Beyerlein, P.E. Clear Creek Solutions, Inc. www.clearcreeksolutions.com
LID Hydrology and Hydraulics Modeling There is nothing magical about LIDs. Water must go somewhere. Water must either: Infiltrate into the soil. Evaporate/transpire into the atmosphere. Runoff.
Why LID Hydrology and Hydraulics Modeling? Effects of land use change on stormwater runoff: Less infiltration and evapotranspiration More surface runoff (increased volume) Runoff leaves the site faster (increased peak flows) Runoff occurs more often (increased duration) Runoff conveyed directly to creek (increased connectivity)
Why Modeling? We use modeling to quantify the hydrologic impacts of LIDs in terms of: (1) Frequency (2) Duration (3) Volume
Frequency Frequency is the probability of a certain size event occurring: 2-year (50% probability) 5-year (20%) 10-year (10%) 25-year (4%) 50-year (2%) 100-year (1%)
Frequency Traditionally we have used single-event design storms to size facilities based on frequency. Design storm assumption: 25-year rainfall causes 25-year flood.
Single-event design storm methodology doesn’t work for LID modeling because: • Single-event flow frequency standards are based on inappropriate assumptions. • Single-event modeling does not compute flow durations for hydromod requirements (flow duration is the percent of time flows exceed a specific value). • Single-event modeling does not include the long-term effects of evapotranspiration.
Duration Flow Duration Analysis: Percent of time the flow exceeds a specific flow value.
Durations • Hydromod flow duration standard: based on erosive flows. • Santa Clara, San Mateo, Alameda counties: 10% of 2-yr to 10-yr
Durations • Hydromod flow duration standard: based on erosive flows. • San Diego County: 20% of 5-yr to 10-yr
Volume Annual runoff volume reduction due to increased infiltration and evapotranspiration.
Accurate simulation of LID hydrology requires continuous simulation modeling • Represent all of the components of the hydrologic cycle. • Include a full range of soil, vegetation, and topographic conditions. • Reproduce observed streamflow for both small and large drainages. • Use long-term local hourly precip to generate long-term hourly runoff.
LID Hydraulics • Represents all conveyance systems, including LIDs. • Routes runoff using linear reservoir routing. • Represents conveyance systems with a table of stage-storage-discharge values (BAHM SSD Table or HSPF FTABLE). • Includes rainfall and evaporation on open water surfaces. • Includes infiltration (if turned on by user)
Potential LID Techniques/Facilities • stormwater infiltration ponds/basins • bioretention cells • planter boxes • porous pavement • green roofs • rain gardens • sand filters
LID Hydrology and Hydraulics Modeling Results • porous pavement • green roofs • bioretention cells / planter boxes / rain gardens
LID Modeling Options Based on continuous simulation hydrology: HSPF (WWHM, BAHM, SDHM) HEC-HMS SWMM
HSPF: HYDROLOGIC SIMULATION PROGRAM - FORTRAN • Continuous simulation model • Natural and developed watersheds and water systems • Land surface and subsurface hydrology and quality processes • Stream/lake hydraulics and water quality processes • Time series data management and storage • Time series data statistical analysis and operations • Core watershed model in EPA BASINS and Army Corps WMS • Development and maintenance activities sponsored by U.S. EPA and U.S. Geological Survey
HSPF: History • 1966 – Stanford Watershed Model by Linsley and Crawford • 1972 – HSP by Hydrocomp • 1973 – ARM (Agricultural Runoff Management) Model for EPA by Hydrocomp • 1974 – NPS (Non-Point Source) Model for EPA by Hydrocomp • 1979 – HSPF (combining HSP, ARM, and NPS) for EPA by Hydrocomp
HSPF Made Easy: SDHM • SDHM: San Diego Hydrology Model using San Diego (Lindbergh Field) rainfall data
Porous Pavement Flow Paths Evaporation from pavement Rain on pavement Surface Runoff Infiltration through pavement Infiltration to gravel subgrade Underdrain Flow Infiltration to native soil
LID: Porous Pavement • Modeling Assumptions: • Porous pavement thickness of 6 inches • Gravel subgrade thickness of 18 inches • Evaporation from gravel subgrade • Infiltration into native soil • No underdrain
LID: Porous Pavement Southern California: Flow Frequency
LID: Porous Pavement Southern California: Flow duration curves
LID: Porous Pavement Southern California: Flow Duration Hours
LID: Porous Pavement Southern California: Annual Flow Volume Reduction
LID: Green Roof Green/vegetated/eco-roof Water is stored in the soil prior to runoff.
LID: Green Roof • Modeling Assumptions: • Green roof vegetation is ground cover • Roof surface flat (< 1% slope) • Flow path length of 50 feet to a drain • No infiltration into building • No underdrain
LID: Green Roof Southern California: Flow Frequency
LID: Green Roof Southern California: Flow duration curves
LID: Green Roof Southern California: Flow Duration Hours
LID: Green Roof Southern California: Annual Flow Volume Reduction
Rain Garden/Bioretention Rain garden/bioretention/landscape swale Water infiltrates into the soil before runoff.
LID: Bioretention • Modeling Assumptions: • Drainage area is 1 acre of impervious surface • Bioretention area is 5% of impervious area draining to it • Top layer of bioretention area is amended soil • Amended soil thickness of 24 inches • Amended soil infiltration rate equals 2 inches per hour • No underdrain
LID: Bioretention Southern California: Flow Frequency
LID: Bioretention Southern California: Flow duration curves
LID: Bioretention Southern California: Flow Duration Hours
LID: Bioretention Southern California: Annual Flow Volume Reduction
Summary • Porous pavement can provide 100% reduction in runoff volume, peak flows (frequency), and durations at very low infiltration rates (< 0.01 in/hr).
Summary • Green roofs reduce • runoff volume by 50-80% • runoff durations by 80-95% • peak flows by 50-70%
Summary • Bioretention reduces • volume and durations by 10-30% for poor draining soils • volume and durations by 40-70% for well drained soils • peak flows by 10-25%
LID Hydrology and Hydraulic Modeling • For more informationGo to:www.clearcreeksolutions.com
LID Modeling • Questions?Contact:Doug Beyerlein 425.892.6454beyerlein@clearcreeksolutions.com