Download
1 / 25
250 likes | 252 Views
This document discusses the physics, tolerances, and simulations of undulators, including components motion monitoring and control, error tolerance budget, and wakefield budget.

E N D
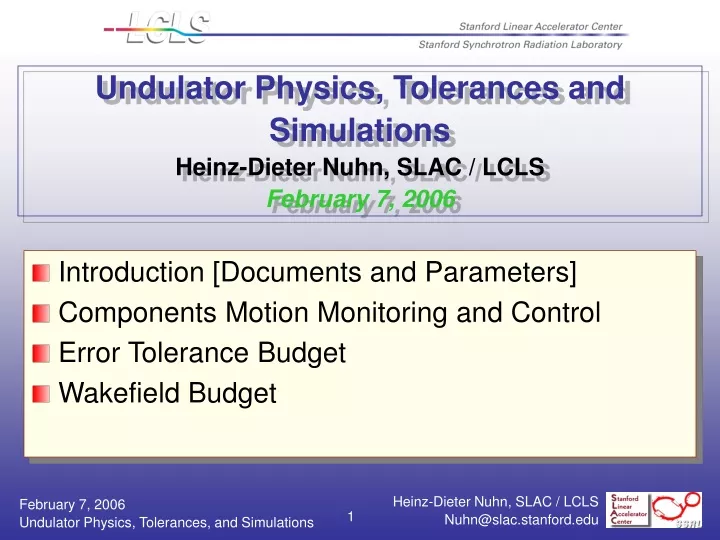
Undulator Physics, Tolerances and SimulationsHeinz-Dieter Nuhn, SLAC / LCLSFebruary 7, 2006 • Introduction [Documents and Parameters] • Components Motion Monitoring and Control • Error Tolerance Budget • Wakefield Budget 1
Summary of Nominal Undulator Parameters Undulator Type planar hybrid Magnet Material NdFeB Wiggle Plane horizontal Gap 6.8 mm Period Length 30.0±0.05 mm Effective On-Axis Field 1.249 T Range of Effective Undulator Parameter K 3.500 - 3.479 (0.6 %) [ 0] K Tuning Tolerance ± 0.015% Accumulated Segment Phase Error Tol. ± 10 degrees(at 1.5 Angstroms) Segment Length 3.40 m Number of Segments 33 Undulator Magnetic Length 112.2 m Standard Break Lengths 47.0 - 47.0 - 89.8 cm Nominal Total Device Length 131.52 m Quadrupole Magnet Technology EMQ Nominal Quadrupole Magnet Length 7.4 cm Integrated Quadrupole Gradient 3.0 (4.0 max) T 4
Strategies for Controlling Component Motion • Girder motion will be caused by • Ground Motion • Temperature Changes • CAM Rotation • Girder motion will be monitored in 2 ways. • Directly, through the Component Monitoring Systems • Indirectly, through impact on electron beam trajectory (as detected by BPMs) • Girder Positions will be frequently corrected using the CAM movers. • Both monitoring venues complement each other but each will be sufficient for maintaining trajectory straightness. 5
Component Position Monitoring Systems(Alignment Diagnostics System – ADS) Wire Position Monitor system (WPM) Resolution < 100 nm in X & Y direction Instrument Drift< 100 nm per day Moving Range±1.5 mm in X & Y direction Accuracy0.1 % of full Scale AvailabilityPermanent, no interrupts X and Y, can be measuredRoll, Jaw & Pitch can be calculated. See presentation by Franz Peters Hydrostatic Leveling System (HLS) Capacitive Sensor Precision < 1 mm Instrument Drift ~1-2 mm / month Accuracy< 0.1 % of full Scale Roll Y Ultrasound Sensor Precision < 0.1 mm Instrument Drift potentially no drift Accuracy< 0.1 % of full Scale Pitch See presentation by Franz Peters 6
Correction Zones* Zone 1 (non-invasive correction) • 120-Hz traj-feedback (LTU BPM’s) • 0.1-Hz traj-feedback (und. BPM’s) Zone 2 (Dt> 1 hr, P/P0 > 90%, non-invasive) • MICADO (best 5) steering within undulator Zone 3 (Dt> 24 hr, P/P0 > 75%, invasive) • Weighted steering of undulator traj. (1 min.) • ... or quadrupole gradient scans - fast BBA (10 min.) • Possible x-ray pointing (few min.) Zone 4 (Dt> 1 wk, P/P0 > 50%, machine time) • One iteration of BBA (<1 hr) Zone 5 (Dt> 6 mo, shut-down) • Reset movers set to zero and manual realignment (1 wk) • Full 3 iterations of BBA (~3 hrs) *Worst Case - no reliance on position monitoring system 7
Correction Zones * (Illustration) BBA- Light *Worst Case - no reliance on position monitoring system 8
LCLS Undulator Tolerance Budget Analysis • Analysis based on time dependent SASE simulations with Genesis 1.3 • Eight individual error sources considered: • Beta-Function Mismatch, • Launch Position Error, • Module Detuning, • Module Offset in x, • Module Offset in y, • Quadrupole Gradient Error, • Transverse Quadrupole Offset, • Break Length Error. • The ‘observed’ parameter is the average of the FEL power at 90 m (around saturation) and 130 m (undulator exit) • The Results are combined into the Error Budget 9
Example – Error 3: Module Detuning Simulation and fit results of Module Detuning analysis. The larger amplitude data occur at the 130-m-point, the smaller amplitude data at the 90-m-point. 130 m 90 m BudgetTolerance Z. Huang Simulations 10
Example – Error 5: Vertical Module Offset Simulation and fit results of Vertical Module Offset analysis. The larger amplitude data occur at the 130-m-point, the smaller amplitude data at the 90-m-point. 130 m 90 m BudgetTolerance S. Reiche Simulations 11
Tolerance Budget • Gaussian fit yields functional dependence of power reduction on error amplitude: • Assuming that each error is independent on the others other, i.e. each error source causes a given fraction power reduction independent of the presence of the other sources: tolerance fitted rms fi=xi/si 12
Tolerance Budget (cont’) z < 1.10.64<b/b0<1.56 13
Model Detuning Sub-Budget < 0.024 % => Sub-Budget is well within allowance of overall budget 14
Power (W) Z (meter) Simulation of Temperature Error Effect On Gain ± 0.5 ºC(K/K = ±5×10⁻⁴) at undulator-end causes only 5-6% power drop if we have the taper set optimally initially. Power degradation for a linear taper error is about the same as for a random modular-K error of the same magnitude Courtesy of Zhirong Huang 15
Wakefield Budget • Undulator Wakefield Sources: • Resistive Wall Wakefields (ac conductivity) => Main Contributor • Mitigation: Aluminum Surface, Rectangular Cross Section • Surface Roughness Wakefields • Mitigation: Limit roughness aspect ration to larger than 300. • Total contribution small compared to resistive wall wakefields • Geometric Wakefields • Sources: • Rectangular to Round Transition • BFW Replacement Chamber Mis-Alignment • RF Cavity BPMs • Bellows Shielding Slots • Flanges • Pump Slots • Total contribution small compared to resistive wall wakefields 16
Short Break Section Chamber Profile Bellows Shielding Slots 35 mm Gaps @ 10 mm dia 20% azimuth BFW Replacement Chamber RF Cavity Length 10 mm Flange (5) Gaps .5 mm Pump Slot Chamber Diameter 8 mm Chamber Diameter 10 mm Undulator Chamber 5x10 mm Undulator Chamber 5x10 mm 17
Long Break Section Chamber Profile BFW Replacement Chamber Flange (7) Gaps 2 mm Bellows (2) Shielding Slots 35 mm Gaps @ 10 mm dia 20% azimuth RF Cavity Length 10 mm Chamber Diameter 8 mm Chamber Diameter 10 mm Undulator Chamber 5x10 mm Undulator Chamber 5x10 mm Pump Slot 18
BFW Wire Replacement Wire Beam Finder Wire (BFW) A misaligned undulator will not steer the beam. It will just radiate at the wrong wavelength.The BFW allows the misalignment to be detected. (allows beam size measurements) Beam Direction 19
Undulator Wakefield Parameters Surface Roughness Parameters Segment Chambers 5 mm dia.; Aspect Ratio 300; Short Break Chambers 10 mm dia.; Aspect Ratio 100; Long Break Chambers 10 mm dia.; Aspect Ratio 100; Resistive Wall Parameters Segment Chambers par plates 5 mm sep, Al AC; Shielded Bellows 10 mm dia. cir.; Cu AC; Short Break Chambers 10 mm dia. cir.; Cu AC; Long Break Chambers 10 mm dia. cir.; Cu AC; Transition Model Parameters Segment to Break Chamber 5 mm x 10 mm 8 mm dia; 153 V/pC BFW Replacement Chamber 0.5 mm displacement; 10 mm dia; 69.8 V/pC Diffraction Model Parameters RF Cavity BPMs 35 mm gap @ 10 mm dia., 20 % azim. Flanges 2 mm gap @ 10 mm dia. Pump Slots 10 mm gap @ 10 mm dia., 68 % azim. 20
Total Longitudinal Wake Field Summary Beam Energy = 13.64 GeV Undulator Length = 132 m Bunch Core (0.45 nC): <Wc> = -77.2 keV/m(-0.075 %) Wc,rms = 119.6 keV/m ( 0.12 %) Total Bunch (1 nC): <Wt> =-283.0 keV/m(-0.27 %)Wt,rms = 229.7 keV/m ( 0.22 %) r 52.0 keV/m (0.50 %) 21
Total Longitudinal Wake Budget Summary Beam Energy = 13.64 GeV Undulator Length = 132 m Total Charge = 1 nC Core Charge = 0.45 nC Transverse Wakefields Negligible ! De/e < 0.1 % for 100 µm beam offset 22
Power Profile at 100 m Average Power vs z tail head GENESIS Simulation of Wake Contributions Start-to-End Simulation All Wakefields Included Total Charge: 1 nC Beam Energy: 13.64 GeV Wavelength: 1.5 Å 23
Summary • Two complementary ways of mitigating the effect of component motion have been identified incorporating a Correction Zone approach. • Undulator tolerance parameters have been combined in a tolerance budget. The analysis is based on GENESIS simulations. Tolerances were balanced to allow relaxation of critical tolerances: • Temperature Stability is now 0.5oC (was 0.2oC) • Vertical Segment Alignment is now 80 µm (was 70 µm) rms • Short Term (1hr ) Quadrupole/BPM Stability 2 µm (was 1 µm in 10 hrs) • Long Term (24hrs ) Quadrupole/BPM Stability 5 µm • A comprehensive undulator wakefield budget keeps track of the various wakefield sources during the component design phase. GENESIS simulations confirm that the expected wakefield amplitudes are consistent with FEL performance expectations. 24