Download
1 / 20
200 likes | 310 Views
Erika Blanco Fall 2010 ACG2021.001. Executive Summary.

E N D
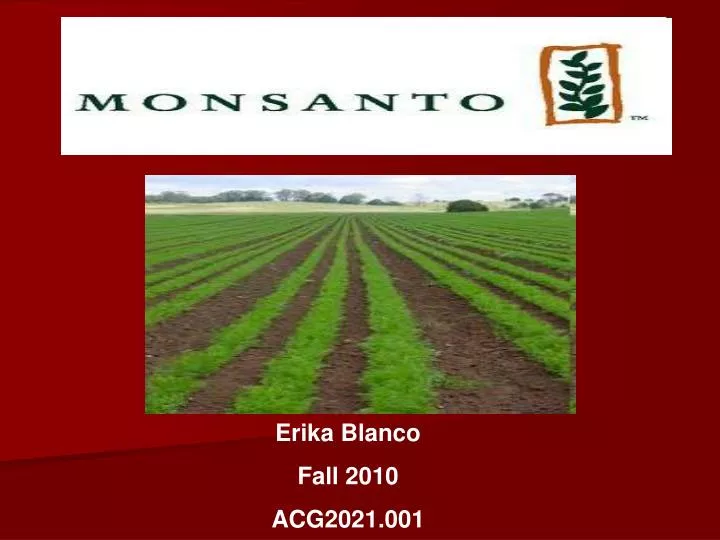
Erika Blanco Fall 2010 ACG2021.001
Executive Summary • Monsanto is a multinational agricultural company, that takes pride in it’s innovative biotechnology expertise, research, global marketing, and consumer relations. Monsanto brought to the market the first herbicide, Roundup, that would effectively eliminate weeds from farmers’ fields, and from there they developed the only Roundup resistant soy bean. Because of the economic downturn, along with the public organic food movement, and bad publicity from media, Monsanto began to take a loss. They have responded to this loss by using assets to lower liabilities, and keep more retained earnings, to put back into the company. Monsanto has a ten year plan to bring several new products to the market, adjust their public image, and return value to shareholder’s. • http://www.monsanto.com/investors/Pages/2009-annual-report.aspx • http://finance.yahoo.com/q/is?s=MON+Income+Statement&annual • http://finance.yahoo.com/q/bs?s=MON+Balance+Sheet&annual • http://finance.yahoo.com/q/cf?s=MON+Cash+Flow&annual
Mr. Hugh Grant, 52, is the Chairman, President, and Chief Executive Officer of Monsanto. Monsanto Company800 N. Lindbergh Blvd. St. Louis, MO 63167 Ending date of last fiscal year, August 31, 2009. Monsanto offers farmers a wide range of corn, soybean, cotton, wheat, canola, sorghum and sugar cane seeds. Monsanto’s geographic area of activity is very diverse, including the continents North America, Asia, Central and South America, Europe, Middle East, and Africa. Part A. Introduction
Part A. Audit Report • Deloitte & Touche LLP, independent registered public accounting firm. • The opinion of the auditing firm was that the company maintained adequate management over financial reporting as of August 31, 2009. However, the statements of consolidated financial position and related statements of consolidated operations, cash flows, shareholder’s equity, and comprehensive income for year ended August 31, 2009, expressed an unqualified opinion regarding those financial statements.
The close price for September 29, 2010 is 48.00. The dividend per share is 2.33% per share. Information accessed on September 29, 2010 . Twelve month trade range: $77.23 – $48.75. Based on my analysis, I would not purchase stock from Monsanto. After evaluating the activity over the past year, their stock has steadily decreased since January 2010. Part A. Stock Market Information
Part B. Industry Situation and Company Plans • Monsanto is a U.S. based multinational agricultural company. Founded in St. Louis, MI , in 1901, they first began producing the herbicide, Round-Up, and then continued on to become one of the world’s producers of Genetically Modified Seeds. Monsanto produces the RoundupReady soybean, which is resistant to the signature pesticide. Monsanto was a producer of the artificial sweetener Aspartame until 2000, and they currently produce the bovine hormone, rBST. As of April 2010, The U.S. Justice Department is investigating the company’s marketing practices. • Monsanto has several new products coming to the market. Stated in the Letter to Stockholder’s, years 2010, 2011, and 2012, will be key years in seeing these new products deliver on the farm. Monsanto pride’s itself on world-class biotechnology expertise, discovery research, genomics expertise, global marketing expertise, and Global-scale production capabilities.
Part B. Industry and Company Plans • Monsanto states in their 2009 Annual Report, that 2009 was a difficult year for their Roundup business due to a greater than anticipated global glyphosphate supply. • Monsanto has implemented a company-wide restructuring and cost reduction initiative that netted significant savings. • For 2010, they project total company gross profit of $6.1 billion to $6.3 billion. • Monsanto plans to actively reinvest their free cash flow to increase seeds and traits business, and return value to shareholders through share repurchases, dividends, and acquisitions in new crop spaces- wheat and sugar cane.
The format of Monsanto’s income statement is multistep. Comparing the Gross Profit, Income from Operations, and Net Income, from 2008 to 2009, it appears the company has seen an overall increase in profits. Part C. Income Statement
Part C. Balance Sheet • Shown in the balance sheet, assets and liabilities decreased, while stockholder’s equity increased. I believe this shows the company is selling some of their assets to decrease their liabilities. Retained earnings increase by over $1 billion, from 2008 to 2009. They seem to be repurchasing shares, and dividends to put money back into the company. There was an increase in property plant and equipment, to support this.
Part C. Statement of Cash Flows • Cash flows from operations from the last two years, are more then the net income of the previous two years. • The company made some notable changes in liabilities, by paying down approximately $1.02 billion. The company is growing significantly through investments, by $294 million. • The company’s only other source of financing, is from other Cash Flows from Financing Activities. The dividends paid, sales purchase of stock, and net borrowings, all decreased. • Overall, cash has decreased from $747 million to $343 million.
Part D. Accounting Policies • Estimation: In order for Monsanto to apply their accounting policies, they often make estimates based on judgments about future events. They rely on historical experience, market, other conditions, and on assumptions they believe to be reasonable. The estimation process is uncertain, and if the market changes the results of operations and financial condition, may be materially affected. • Seasonality: The fiscal year end of August 31st, synchronizes the quarterly and annual results with the natural flow of the agriculture cycle. • Basis of Consolidation: The financial statements are presented in accordance with accounting principles generally accepted in the U.S.
Part D. Accounting Policies • Cash and Cash Equivalents: All highly liquid investments are considered cash equivalents. • Accounts Receivable: The company provides an allowance for doubtful trade receivables equal to the estimated uncollectible amounts. • Long Term Investments: Monsanto has long-term investments in equity securities, which are categorized as available-for-sale. • Revenue Recognition: The company derives most of its revenue from three main sources, sales of branded, conventional seed and traits, royalties and license revenue, and sales of agricultural chemical products.
Goodwill Intangible Assets Shipping and Handling Costs Marketing and Advertising Research and developmental costs Foreign Currency translation Derivatives of other financial instruments Pension and post retirement plans Stock based compensation Income taxes Fair values of assets and liabilities Inventory evaluation Plant, Property, and Equipment Environmental remediation liabilities Litigation and other contingencies Guarantees Part D. Accounting Policies
Part E. Financial Analysis Liquidity Ratios • (2009) Working Capital= 7,883,000-3,756,000=4,127,000 • (2008) Working Capital= 7,609,000-4,439,000= 3,170,000 • The positive result shows income that can be used for other investments. • (2009) Current Ratio=7,883,000/3,756,000=2.10 • (2008) Current Ratio=7,609,000/4,429,000=1.71 • The current ratio has increased, meaning they have increased their short-term debt-paying ability. • (2009) Receivable Turnover=11,724,000/((285,000+3,147,000)/2)=3.91 • (2008) Receivable Turnover=11,365,000/((3,147,000+2,355,000)/2)=4.13 • The RT has decreased; the company is not turning as much receivables into cash.
Part E. Financial Analysis Liquidity Ratios • (2009)Invetory Turnover= 4,962,000/((2,934,000+2,453,000)/2)=1.84 • (2008)Inventory Turnover=5,188,000/((2,453,000+1,719,000)/2)=2.49 • The company has decreased the amount of inventory being sold. • (2009) Average day’s sales uncollected=365/3.91=93.40 • (2008) Average days’ sales uncollected=365/4.13=88.38 • In 2009, it takes longer for the company to receive payment on credit sales. • (2009) Average days’ inventory on hand=365/1.84=198.37 • (2008) Average days’ inventory on hand=365/2.49=146.59 • It takes more days in 2009, to sell inventory then 2008.
Part E. Financial Analysis Profitability Ratios • (2009) Profit Margin= 2,109,000/11,724,000=.170 • (2008) Profit Margin= 2,024,000/11,365,000= .178 • There was a decrease in the percentage of sales each dollar contributes to net income. • (2009) Asset Turnover=11,724,000/((7,883,000+7,609,000)/2)=1.51 • (2008) Asset Turnover=11,365,000/((7,609,000+5,084,000)/2)=1.79 • In 2009, the company was not as efficient in using assets to produce sales. • (2009) Return on Assets=2,109,000/(17,877,000+17,991,000)/2)=.118 • (2008) Return on Assets=2,024,000/((17,991,000+12,983,000)/2)=.131 • There is a decrease in how efficiently assets are produced into income. • (2009) Return on Equity=2,109,000/((10,056,000+9374,000)/2)=.217 • (2008) Return on Equity=2,024,000/((9,374,000+7,503,000)/2)=.240 • There is a decrease in the amount earned by the company to each dollar stockholders invested in the business.
Part E. Financial Analysis Solvency Ratio • (2009) Debt to Equity= 7,821,000 / 10,056,000 = .778 • (2008) Debt to Equity= 8,617,000 / 9,374,000 = .919 • The debt to equity ratio shows the proportion of a company’s assets financed by creditors and the proportion financed by stockholders. According to the values 78% for 2009, and 92% for 2008, there is a notable decrease. This decrease indicates that the company has resolved some of the high risk, in repaying creditors. In 2009, the company was receiving more then half its financing from investors.
Part E. Financial Analysis Market Strength Ratios • 2009 Price/earnings per share= 4.34 • 2008 Price/earnings per share= 6.50 • The investors’ confidence in this company’s future has decreased. • 2009 Dividend yield=3.56% • 2008 Dividend yield=5.34% • The stock return to a investor or stockholder has decreased.
Sources Cited • Monsanto. Ed. Willie Voght. N.p., 2010. Web. 28 Sept. 2010. <www.Monsanto.com>. • Pringle, Peter. Food Inc. New York: Public Affairs, 2009. N. pag. Print. • Kasky, Jack. "Monsanto’s Roundup Ready 2 Soy Yields Meet Forecast, OTR Says." Bloomberg. Ed. Simon Casey. Bloomberg, 30 Sept. 2010. Web. 30 Sept. 2010. <http://www.bloomberg.com/news/2010-09-30/monsanto-s-roundup-ready-2-soy-yields-meet-forecast-otr-says.html>.