Download
1 / 30
300 likes | 580 Views
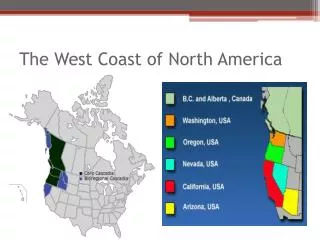
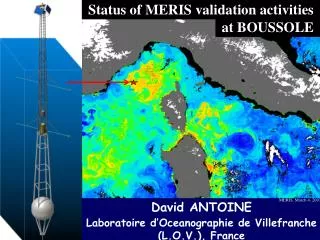
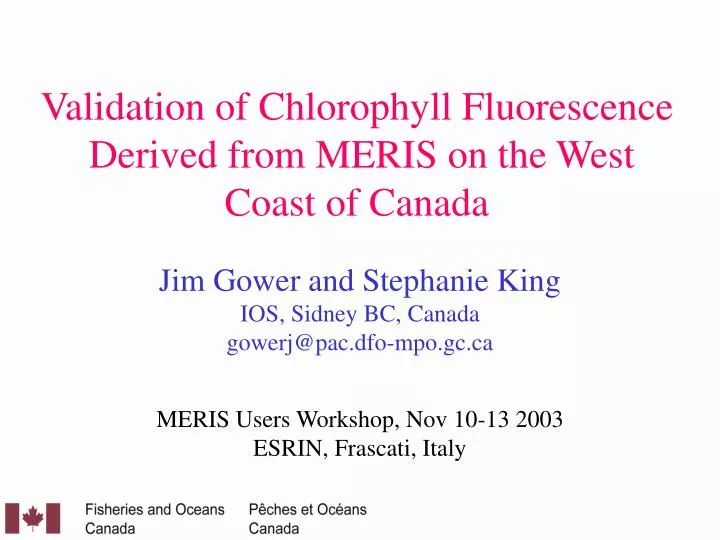
Validation of Chlorophyll Fluorescence Derived from MERIS on the West Coast of Canada. Jim Gower and Stephanie King IOS, Sidney BC, Canada gowerj@pac.dfo-mpo.gc.ca MERIS Users Workshop, Nov 10-13 2003 ESRIN, Frascati, Italy. MERIS image data received Vancouver Island, west coast Canada.

E N D
Validation of Chlorophyll Fluorescence Derived from MERIS on the West Coast of Canada Jim Gower and Stephanie King IOS, Sidney BC, Canada gowerj@pac.dfo-mpo.gc.ca MERIS Users Workshop, Nov 10-13 2003 ESRIN, Frascati, Italy
MERIS image data receivedVancouver Island, west coast Canada • 50 L1 RR images in 2002, starting May 17 • 50 L1 RR images in 2003 to end August • Latest to Oct 2 • 100/157 possible, about 40 “usable” • Level 2: 42 in 2002, 10 in 2003 to Aug 31 • FR data for only 9 dates (8 usable)
Above-surface reflectance spectra observed off Vancouver Island with the IOS spectrometer. 1 and 16 mg.m-3 chlorophyll. MERIS bands 1 to 12 plotted
“True” (2,5,7) Algal 1MERIS FR data 28 June 2003
FLH (7,8,9) RTI (8,9,10)MERIS FR data 28 June 2003
Variation of Fluorescence with Chlorophyll Concentration (C) Solid line: Fluorescence = 0.15 C / (1+0.2 C) compared to Babin et al. (1996) dashed line. (0.2 C is ratio of absorption of fluorescence by chlorophyll to absorption by pure water).
Comparison of MERIS FLH with IOS cruise 2002-30 (August 25 to 27 2002) surface extracted chlorophyll at stations in Juan de Fuca Strait and off Vancouver Island
Surface extracted chlorophylls from all of the IOS cruise 0302 stations from Feb 24th to Feb 28th compared with Meris FLH for Feb. 24th and 27th, 2003 (waters off Vancouver Island, Canada)
Characteristic vectors derived from area B (120 by 120) of Sept 21 2002 L1 RR data (Wei Yan)
MERIS MODIS MERIS sees 1.39 +/- .10 times MODIS. Expect 1.35 due to band locations.Range is 0.4 compared to 0.25, W.m-2.mm-1.ster-1
Reduced resolution (1200m) Full resolution (300m) MERIS FLH images, comparing full and reduced resolutions in part of the July 10 2002 scene
Comparing full and reduced resolution MERIS FLH in part of the July 10 2002 scene
Conclusions • Fluorescence patterns show up well along the BC coast • Fluorescence signal is reasonably consistent with surface chlorophyll • MODIS/MERIS ratio = 1.35. • FR data should be useful for biomass mapping in inlets, especially for small, intense events. • Modified MERIS bands should be used to study the 650 to 720 spectral region
MERIS observations with a modified spectral band set (AO 612) This is a major capability of MERIS which has yet to be adequately demonstrated MERIS can bring added resolution to the 660 to 720 nm chlorophyll fluorescence/absorption/red edge region of the spectrum, providing brief periods of global coverage. Disruption of the standard observations would be no worse than occur regularly for meteor showers and equipment/logistic failures. MODIS, the alternative satellite sensor, lacks this ability.
Spectral band positions and widths providing contiguous coverage of the wavelength range 650 to 723.5 nm with a resolution of 7.5 to 10 nm. Two days of global data required for each of Jan/Feb and July/Aug. MERIS altered band set (AO612)