Download
1 / 31
310 likes | 457 Views
FROM DISINTEGRATION TO REINTEGRATION: EUROPE AND CENTRAL ASIA IN INTERNATIONAL TRADE. Harry G. Broadman Lead Economist and International Trade Policy Coordinator Europe and Central Asia Regional Operations The World Bank March 30, 2005. Main Questions.

E N D
FROM DISINTEGRATION TO REINTEGRATION:EUROPE AND CENTRAL ASIA IN INTERNATIONAL TRADE Harry G. Broadman Lead Economist and International Trade Policy Coordinator Europe and Central Asia Regional Operations The World Bank March 30, 2005
Main Questions 1. How have the nature, extent and patterns of international trade flows for the countries in ECA changed since the transition from communism to capitalism and what do the current trends portend for the future?
Main Questions (cont’d) 2. Why have some countries in the region integrated internationally more then others and what is the emerging relationship between greater integration and geography, policy reforms, growth and poverty reduction?
Main Questions (cont’d) 3. What best determines how effective ECA countries will be in using trade as a lever for growth and poverty reductions and what are the priority issues that policy-makers in the region and the international community should focus on?
ECA is a diverse and heterogeneous region of 29 countries/entities A story of recession and recovery with different faces: variation in macro performance in Central Europe and Baltic countries vs. CIS ECA: Real GDP Growth 7.5 5.0 Central Europe & Baltic 2.5 Countries 0.0 1990 1991 1994 1995 1996 1997 1998 1999 2000 1993 2001 2002 2003p 1992 -2.5 G ECA Region -5.0 CIS -7.5 -10.0 -12.5 -15.0
A fundamental linkage between the transition and international integration The transformation in ECA’s trade flows was central and indispensable to the more well-known economy-wide domestic changes within the region toward reliance on market systems and incentives and the overall transition process
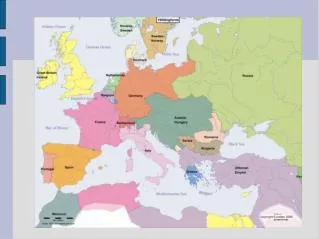
ECA first experienced disintegration… In the early 1990s the break-up of a highly integrated trade bloc with a unified geographic-economic space that was isolated from the global economic system • Russia: aftermath of the collapse of the FSU characterized by striking differences and weak integration among the regions (e.g. Siberia) • Armenia: direct and indirect trade shocks resulted in 85% loss in GDP • Former Yugoslavia: its disintegration was punctuated by war and blockages left the Western Balkans in isolation
…and now various forms of internationalre-integration By 2004 a re-configured region with countries integrating with each other and into the global marketplace, but at differing speeds and patterns • Trade, FDI flows, and international integration fairly extensive for CEE and Baltics • Integration of CIS countries highly constrained, especially for the land-locked Central Asia and the Caucasus • SEE formally liberalized trade regimes, yet still emerging from conflict
Heterogeneity in the nature and extent of integration Growth rates of merchandise trade flows vary significantly: EU8 and SEE most rapid export growth Source: IMF DOT Statistics, data for CIS 1990-1993 from Michalopoulos, Tarr (1994)
Heterogeneity in the nature and extent of integration (cont’d) Trade in services also dramatically changed across sub-regions Source: IMF- Balance of Payments Statistics
Total Export Share (%) Exports Food & Agric Raw Ores & All Wood & Leather & Textiles & Machinery Motor Veh Misc. ($million) Exporter Year Feeds Materials Metals Fuels Manuf Chemical Papers Rubber Clothing excl auto & Parts Manuf. All ECA 1996 247493 17.1 4.9 6.3 13.2 56.5 8.7 2.4 2.3 13.0 11.2 3.2 6.2 2003 461054 12.3 4.4 7.4 15.7 56.6 5.7 2.5 2.5 11.7 13.9 4.4 6.2 CEEC8 1996 83456.1 11.5 5.7 3.2 5.5 71.5 9.5 5.2 2.1 12.1 17.0 6.6 9.3 2003 195259.4 7.0 5.9 2.7 5.1 78.9 7.0 5.4 2.1 8.0 26.5 10.7 10.4 CIS 1996 118387.4 12.7 5.7 9.1 29.6 40.4 8.3 0.8 0.9 7.6 8.1 2.1 3.0 2003 181942.4 9.6 4.7 13.0 34.4 30.1 3.7 0.6 0.5 6.0 6.3 1.4 1.8 SEE8 1996 10115 25.1 4.2 7.4 4.2 58.4 8.5 1.5 4.8 16.4 9.6 1.2 7.0 2003 22069 18.6 3.5 5.8 4.6 66.1 5.0 2.0 6.2 22.0 11.5 1.2 7.6 Heterogeneity in the nature and extent of integration (cont’d) Commodity composition has changed greatly for EU8/SEE; in CIS a significant role of energy and natural resources trade still dominant Table: Structure of ECA’s Exports by Major Product Category, 1996 and 2003 Source: Computations based on UN COMTRADE Statistics
Heterogeneity in the nature and extent of integration (cont’d) Factor composition varies greatly: EU8 exports most capital-intensive; SEE has more unskilled labor-intensive exports than CIS. Source: Computations based on UN COMTRADE Statistics
ECA’s "new" integration differs significantly from the “old” one On a global basis, ECA exports are mainly Euro-centric But intra-ECA trade has become bificurated • CIS trade flows within the region have become more (sub-) regionalized and concentrated; • Trade flows for the EU8 and SEE countries have become more diffused
The emergence of two trade poles: direction of trade flows Source: IMF DOT Statistics Source: IMF DOT Statistics
The emergence of two trade poles: yet still heterogeneity However, the two poles are uneven in economic size, with the magnitude of the trade and investment flows and market size of the Euro-centric one outweighing those of the Russia-centered one. Moreover, this masks the more complex intra-regional differences: • not all of the countries fall exactly into these two groups, and • even within each of the two poles, there are significant differences among the countries
How open are ECA’s economies? ECA -- a ‘normal’ trading region: GDP share of trade comparable to other regions with similar development & size Trade Openness = F (GDP, Populations, Country Identity) Note: Standard errors in parentheses. Significance level: *** 1 percent; ** 5 percent; * 10 percent IV (2SLS) regressions with robust standard errors Source: Author’s calculations
How open are ECA’s economies? (cont’d) Note: Coefficients from model with dummy variables used (i.e., Model 1 in previous Table a=2002 data; b=1999 data; c=1996 data; d=2001 data; e=data unavailable; f=Moldova, Tajikistan and Uzbekistan are outliers due to large measurement errors
How did trade policies become more liberal? Most of the liberalization has been done by the countries themselves through: • Lowering tariffs
How did trade policies become more liberal? (cont’d) • Global integration • reorientation of trade and investment to the rest of the world, especially towards the EU • increasingly active participation in the multilateral trading system • many are members of the WTO: 19 are WTO members (and 9 are WTO observers) • Intra-regional integration and emergence of RTAs: CEFTA, BFTA, SEE network of BTAs, CIS FTA (CIS-wide BTAs), Eurasia Economic Community (‘Evrazes’-CIS-5), Central Asian Cooperation Organization
Variable impacts of RTAs on trade performance and deeper integration CEFTA and BFTA: catalysts for increased intra-regional trade; facilitated participating countries’ commitments to the EU acquis For CIS and SEE, RTAs have had more limited impacts • implementation lags commitments; politically-based distortions; complex rules of origin and weak customs Fostered deeper integration? Most RTAs have not liberalized trade in services—transit barriers in Central Asia; migration; slow structural reforms
How has market-based trade in ECA contributed to growth? Improved productivity through: • deeper import competition and enhanced business efficiency • greater access to higher quality imports with embodied technology • more extensive specialization • economies of scale that come with integration
Trade’s economy-wide effects on domestic structural and institutional reform: A “two-way street” Countries that have integrated the most have made more progress implementing market institutions and domestic policy reforms, which in turn have led to more vibrant businesses and greater job creation
Trade’s economy-wide effects on domestic structural and institutional reform: A “two-way street” (cont’d) Establishing trade links, especially under international commitments and agreements, helps ‘lock in’ hard-won domestic market reforms Trade policy reform is necessary but not sufficient … … complementary market-oriented ‘behind-the-border’ policies are just as important
‘Behind the border’ policies and market institutions are … … important in harnessing the ways in which trade can leverage growth and reduce poverty Key ‘behind-the-border’ reforms are: • creating a more competitive domestic business climate • improving trade and transport facilitation systems • liberalizing domestic services sectors and associated regulatory reform • attracting FDI to link into global production networks • creating flexibility in labor and capital markets to reallocate resources
Priority Policy RecommendationsI. Trade policy reforms Reduction of tariffs and NTBs over medium term Simplification of tariff regimes Design of trade policy reforms to engender incentives for greater product diversification EU CAP Agriculture Non-Market Anti-Dumping Pursuit of the WTO accession Rationalization of bilateral FTAs Extension of regional co-operation beyond preferences in merchandise trade (incl. trade facilitation and liberalization of services)
Priority Policy Recommendations (cont’d) II. Behind the border policies Greater inter-enterprise competition in the domestic market Trade facilitation and logistics Customs reform TA and investment in capacity building Liberalization of the services sectors Improve FDI policy regime Complementary polices to reduce poverty
Principal Messages … ECA is today more integrated into the global economy than at the start of the transition, and without open trade, the transition would not have happened
Principal Messages … Two trading blocs are emerging in ECA—one ‘Euro-centric’ (EU8 and SEE), the other ‘Russia-centric’ (CIS)—whether in terms of direction of trade flows, commodity and factor composition of trade, intra-industry trade and participation in global production sharing networks through FDI But there is significant intra-bloc heterogeneity and a sizeable inter-bloc difference in scale
Principal Messages … ECA countries that have pursued both trade policy and related behind-the-border institutional reforms have been able to leverage effectively greater integration into increased growth and reduction of poverty For many ECA countries, a large unfinished reform agenda remains
Principal Messages … Some problems require action by developed countries—especially market access in agriculture and anti-dumping But much of the needed reforms are in the ECA countries’ hands, including pursuit of WTO accession (where the prospect of EU accession is unrealistic) and rationalization of the many RTAs