Download
1 / 32
320 likes | 333 Views
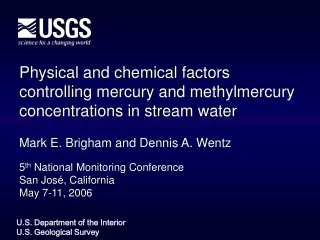
The Snowball Effect: Statistical Evidence that Big Earthquakes are Rapid Cascades of Small Aftershocks. Karen Felzer U.S. Geological Survey. Earthquakes have often been modeled as avalanches of small subevents. Housner (1955) Vere-Jones (1976) Kagan and Knopoff (1981)

E N D
The Snowball Effect: Statistical Evidence that Big Earthquakes are Rapid Cascades of Small Aftershocks Karen Felzer U.S. Geological Survey
Earthquakes have often been modeled as avalanches of small subevents • Housner (1955) • Vere-Jones (1976) • Kagan and Knopoff (1981) • Zeng et al. (1994) • Rydelek and Sacks (1996) • Lavallee and Archuleta (2003) • …….
How do the small subevents organize into a rapid, propagating chain? Kagan and Knopoff (1981): Subevents trigger each other via the aftershock process Small subevent Mainshock fault plane
Fundamental Idea of Kagan and Knopoff (1981) Mainshock propagation = Aftershock Triggering Omori’s Law If the time gap between subevents comes from here, we see a single, larger earthquake If the time gap comes from here we see a separate mainshock and aftershock Here we propose an earthquake propagation model based on this idea, called the Aftershock Avalanche Model
Aftershock Avalanche Model Points of high strength Fault plane An aftershock subevent is triggered; earthquake grows Earthquake remains small OR • A subevent nucleates at a point of weakness • On average, the subevent is stopped by strength heterogeneities when it reaches area A • If waves from the subevent quickly trigger an aftershock subevent, propagation may continue
Aftershock Avalanche Model Characteristics • Thesmallest “unit” subevents, have an equal area A (Different from Kagan & Knopoff model) • Mainshock propagation and aftershock triggering are the same process=> time lagbetween a triggering and triggered unit subevent followsOmori’s Law for aftershock decay (Kagan and Knopoff (1981)). • Each unit subevent triggers the same number of aftershocks, independent of current earthquake size (Vere-Jones, 1976) • Over all time, the average number of aftershocks triggered per subevent = 1 (Vere-Jones, 1976)
Two tests of the Aftershock Avalanche Model • Monte Carlo Simulations (preliminary, rough) • Comparison of Aftershock Avalanche model predictions with earthquake catalog statistics (well developed, robust)
1st Test of Aftershock Avalanche Model Do Monte Carlo model realizations reproduce the Gutenberg-Richter relationship (with b = 1) and realistic earthquake time series?
Monte Carlo Simulation Basics • Model starts with a few random subevents • Locations of triggered subevents: Chosen randomly from distribution cr-1.4(Felzer and Brodsky, 2005) • Time of triggered subevents: S wave travel time + minimum wait time (tmin) + Omori’s Law (at-p)
Monte Carlo Simulation: Combining subevents into earthquakes t Composite earthquake Unit subevent time • If t < (0.2s)x(√(no. subevents in existing earthquake)) => Subevent is added to the preceding earthquake • Composite Magnitude= log(Earthquake Area)
Results of 1st Test • Monte Carlo Simulations of the model (with approximate parameters) reproduce a power law distribution of earthquake magnitudes & Omori’s Law • =>The model is consistent with the fundamental empirical earthquake statistics
2nd Test of Aftershock Avalanche Model Do predictions of the model agree with observed data?
Aftershock Avalanche Model Prediction #1 • The nucleation of unit subevents = high frequency bursts -- should be seen during an earthquake, on the mainshock fault. • The initiation times of the bursts should follow Omori’s law from the arrival time of the wave front
1999 Chi Chi earthquake: High frequency bursts seen on mainshock fault Filtering the mainshock seismogram reveals many high frequency bursts (Chen et al., in press) Chen et al. (in press) and Fischer and Sammis (2005)
Chi-Chi high frequency bursts follow Omori’s Law Chen et al. (in press) and Fischer and Sammis (2005)
Aftershock Avalanche Model Prediction #2 Mainshock Propagation = Dynamic Stress If mainshock propagation = aftershock triggering Aftershock triggering = dynamic stress
Test for Dynamic Stress Aftershock Triggering • Dynamic stress change accomplishes distant triggering • Static and dynamic stress changes decay at different rates with distance • If far & near field aftershock densities decay with distance at the same rate => Dynamic triggering throughout Triggering by the Denali Earthquake; Gomberg et al. (2004)
Test for Static or Dynamic Aftershock Triggering: What we should see Approximate expectation Exact expectation To get a wide distance range with respect to mainshock size, we use a range of mainshock magntiudes
Dynamic Triggering Results Aftershock density decay with distance is constant from0.05 to 280 Fault Lengths => Dynamic triggering throughout (Felzer and Brodsky, 2005)
Avalanche Aftershock Model Prediction #3 The aftershocks produced by each unit subevent are statistically constant, independent of the number of nearby subevents (from Vere-Jones (1976) and Kagan and Knopoff (1981)) All aftershock statistical properties (temporal distribution, spatial distribution, magnitude distribution) are independent of mainshock magnitude.
Data Set for Testing Prediction #3 • We use mainshocks from three different magnitude ranges: M 2--3, M 3--4, and M 4--5. Mainshocks selected are all mainshocks well separated in space/time from larger mainshocks. • Aftershocks data sets are all of the M≥2 aftershocks triggered by the mainshocks in a given unit magnitude range • Random aftershocks are then removed from each set such that the final data sets contain equal number of aftershocks.
Aftershock spatial distribution is independent of mainshock magnitude
Aftershock temporal distribution is independent of mainshock magnitude
Aftershock magnitude distribution is independent of mainshock magnitude
Results of 2nd Test Several observational predictions of the Aftershock Avalanche model are satisfied by the data. These include: High frequency bursts, following Omori’s law, are observed during mainshocks Aftershocks appear to be dynamically triggered Aftershock properties are independent of mainshock magnitude
Aftershock Avalanche model implications for Earthquake Probability Forecasting Traditional renewal model: Slip only initiates when stress is high enough to guarantee through going rupture. Prediction potential. Aftershock Avalanche Model: Slip may initiate whenever the weakest point is ready. Any earthquake may be large (or not) -- no special conditions required. No predictability.
Conclusions • We propose that earthquakes propagation = rapid aftershock chain of unit subevents of equal area: Aftershock Avalanche Model. • Monte Carlo model simulations reproduce G-R and Omori’s Laws. • Model predictions of aftershock physics and scaling relationships are satisfied by the data. • In the model no special circumstances are required to produce a large earthquake => Earthquake magnitude cannot be predicted