Download
1 / 14
140 likes | 258 Views
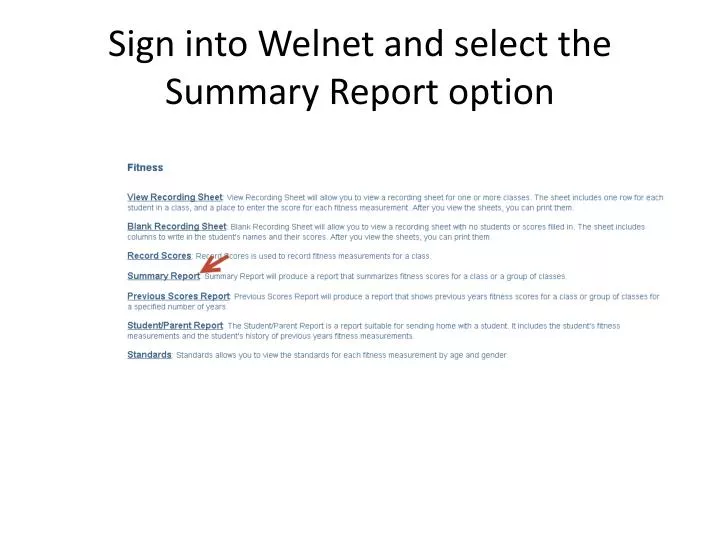
Sign into Welnet and select the Summary Report option. For a whole school report, make sure all classes have a check mark. Scroll to the bottom, include students, summarize all classes, include the phase and output to a spreadsheet. Click View Summary Report.

E N D
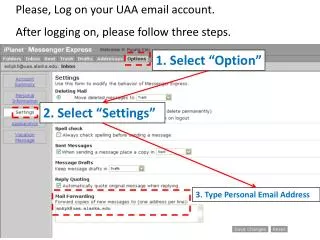
Sign into Welnet and select the Summary Report option
For a whole school report, make sure all classes have a check mark. Scroll to the bottom, include students, summarize all classes, include the phase and output to a spreadsheet. Click View Summary Report.
Welnet will run a report that looks like this. In this example student names have been blocked out.
Delete ALL columns except the one you want to find the average of. To delete, click on the letter heading at the very top of each column, right click and select delete.
Highlight Column A, Choose Sort & Filter, then Sort A-Z
Now your numbers should be in order from lowest to highest, Delete everything that is not a number (some may be above the number, some may be below)
Scroll down and locate and items that are not scores (including blank spaces). Highlight and delete them
Highlight the first column by clicking on the ‘A’ at the top of it. Select the Data tab at the top of the screen, then click on Text to Columns
Uncheck the Tab option, check Other and place a colon in the box. Then click Finish.
Select the home tab at the top of the screen. Left click on the first cell in the ‘A’ column, drag and highlight until you reach the last score. Then click the autosum button in the upper right part of the toolbar.
Repeat the same steps to create a sum for column B
Do the math… • Take the total of column A and multiply it by 60 to convert to seconds. (3813x60=22,8780) • Add Column A total seconds to Column B (22,8780+8625=237405) • Divide total seconds by the total number of students (237405/311=763.36) • Divide that number by 60 to re-convert back to minutes (763.36/60=12.72 minutes which is equal to a 12:43 average mile time)
Set your goal • By June of 2015, our school mile time average will decrease from 12:43 to 12:28 as measured by our mile run assessment.