Download

1 / 57
780 likes | 1.57k Views
第六章 方差分析 ( Analysis of Variance , ANOVA ). 宇传华 yuchua@163.com www.hstathome.com. ANOVA 由英国统计学家 R.A.Fisher 首创,为纪念 Fisher ,以 F 命名,故方差分析又称 F 检验 ( F test )。用于推断多个总体均数有无差异. Contents. §1. One-way analysis of variance 单因素方差分析 §2. Two-way analysis of variance 双因素方差分析

E N D
第六章 方差分析(Analysis of Variance,ANOVA) 宇传华 yuchua@163.com www.hstathome.com
ANOVA 由英国统计学家R.A.Fisher首创,为纪念Fisher,以F命名,故方差分析又称 F 检验 (F test)。用于推断多个总体均数有无差异
Contents §1. One-way analysis of variance 单因素方差分析 §2. Two-way analysis of variance 双因素方差分析 §3. Multiple comparisons in ANOVA 方差分析的多重比较 §4. 2×2 Factorial Analysis of variance 2×2析因设计的方差分析 §5. Test for homogeneity of variances 方差齐性检验
§1. One-way analysis of variance 单因素方差分析 • 常用数据: • 完全随机设计 • 将个体编号,按随机的方法分配到若干组中,然后收集各组数据的方法。 • 2. 现存多组定量数据的比较(如老中青不同年龄的血脂含量分析)
观察数据 因素也称为处理因素(factor),每一处理因素至少有两个水平(level) (也称“处理组”) 。
方差分析的假定条件 1. 正态性 各处理组(水平)样本是相互独立的随机样本,其总体服从正态分布; 2. 方差齐性相互比较的各处理组(水平)样本对应的总体方差相等,即具有方差齐同 (homogeneity of variance)。 上述条件与两均数比较的t检验的应用条件相同。
One-way analysis of variance(completely random design ANOVA) 单因素方差分析(完全随机设计方差分析) 例6.1 拟探讨枸杞多糖(LBP)对酒精性脂肪肝大鼠GSH谷胱甘肽 (mg/gprot)的影响,将36只大鼠随机分为甲、乙、丙三组,其中甲(正常对照组)12只,其余24只用乙醇灌胃10周造成大鼠慢性酒精性脂肪肝模型后,再随机分为2组,乙(LBP治疗组)12只,丙(戒酒组)12只,8周后测量三组GSH值。试问三种处理方式大鼠的GSH值是否相同? 组间变异 总变异 组内变异
离均差平方和(sum of squares,SS)的分解 组间变异 组内变异 总变异
三种“变异”之间的关系 离均差平方和分解:
One-Factor ANOVAPartitions of Total Variation Total Variation SST Variation Due to Treatment SSTR Variation Due to Random Sampling SSE = + • Commonly referred to as: • Sum of Squares Among, or • Sum of Squares Between, or • Sum of Squares Model, or • Among Groups Variation • Commonly referred to as: • Sum of Squares Within, or • Sum of Squares Error, or • Within Groups Variation
F 值与F分布 ,
附表4 =FINV(0.05,1,10) =FDIST(3.74,2,14)
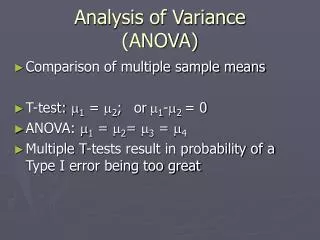
Basic idea of ANOVA方差分析基本思想 Basic idea of ANOVA is to compare to variances to test our hypothesis--hence, analysis of variance Compare Within-group estimate of variance(MSE) and Between-group estimate of variance (MSTR). If they are similar, values in all groups could have come from same population, means could be the same, cannot reject null hypothesis. If variance among sample means is much larger than variance within samples, then sample means are farther apart than the sampling error of the individual sample means, can reject null hypothesis, means are different.
例6.1的方差分析 ⒈提出检验假设,确定检验水准。 H0: 三个组GSH值的总体均数相同; H1: 三个组GSH值的总体均数不全相同; ⒉ 根据公式计算SS、MS及F值 得F=23.85> F0.05(2,32)=3.30。P<0.05,差别有统计学意义,按照0.05的显著性水准,拒绝H0,可认为三种处理方式大鼠的GSH值不全相同。
§2. Two-way analysis of variance双因素方差分析 数据类型 1. 随机区组设计(randomized block design)数据又称为配伍组设计数据。 将受试对象按性质相同或相近者组成 m个组,称为区组或配伍组,每个区组中有k个受试对象,将k个受试对象随机地分到处理因素的k个水平组的一种设计方法。 2. 现存两种因素资料
例6.2 为探讨Rgl对镉诱导大鼠睾丸损伤的保护作用,某研究者将同一窝别的3只大鼠随机地分到T1、T2、T3三组,进行不同处理, 共观察了10个窝别大鼠的睾丸MT含量(μg/g)。试问不同处理对大鼠MT含量有无影响?
⒈提出检验假设,确定检验水准 3.获得P值下结论
§3. Multiple comparisons in ANOVA 方差分析的多重比较 第一节 对例6.1 作了完全随机方差分析 F=23.85,F> F0.05(2,32), P<0.05, 差别有统计学意义,拒绝H0, 可认为三种处理方式大鼠的GSH值不全相同 拒绝H 0,接受H 1, 表示总体均数不全相等 哪两两均数相等? 哪两两均数不等? ———>需要进一步作多重比较。
SNK(Student-Newman-Keuls)法 • 最常用方法之一,其检验统计量为q,故又称为q检验
例6.1三组间两两比较 • 将各组的平均值按由大到小的顺序排列 组别 甲 乙 丙 均数 83.15 75.63 52.27 例数 12 12 12 秩次 1 2 3
做出推断结论 • 第1组与第2组比较:P>0.05,不拒绝H0,差别无统计学意义, 尚不能认为甲组与乙组大鼠GSH值总体均数不相同; • 第1组与第3组比较:P<0.05,拒绝H0,差别有统计学意义, 可认为甲组与丙组大鼠GSH值总体均数不相同; • 第2组与第3组比较: P<0.05,拒绝H0,差别有统计学意义, 可认为乙组与丙组大鼠GSH值总体均数不相同。
第四节 2×2析因设计的方差分析 • 析因设计(factorial design)是将多个因素的各个水平进行排列组合,在每一种可能的水平组合下进行试验,以探讨各因素的效应以及各因素之间的交互效应,而且通过比较各种组合效应,找出最佳组合。
2×2析因设计方差分析的目的 • 考察A、B两因素的“主效应” • 考察A、B两因素间的“交互效应”
表6-11 小鼠BALF中IL-4值(pg/ml)40只小鼠随机分配到4组A1B1、A1B2、 A2B1、A2B2
方差分析的使用条件 • 各处理组样本来自随机、独立的正态总体------- (W法、 D法、卡方检验推断) • 各处理组样本的总体方差相等 ------ Bartlett检验法 、Levene检验法