Download
1 / 1
10 likes | 94 Views
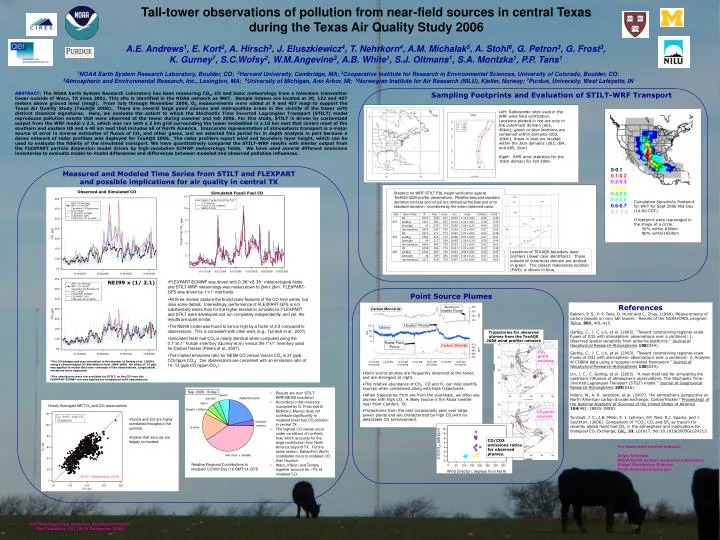
Hourly Averaged WKT O 3 and CO observations. Ozone and CO are highly correlated throughout the summer. Implies that sources are largely co-located.

E N D
Hourly Averaged WKT O3 and CO observations • Ozone and CO are highly correlated throughout the summer. • Implies that sources are largely co-located. Statistics for WRF-STILT PBL height verification against TexAQS-2006 profiler observations. Relative bias and standard deviation (rel.bias and rel.sd) are defined as the bias and error standard deviation, normalized by the mean observed value. 457m, September 2006 Relative Regional Contributions to Modeled CO Mid-Day (19 GMT/14 CDT) 0-0.1 0.1-0.2 0.2-0.3 0.3-0.4 0.4-0.5 0.5-0.6 0.6-0.7 0.7 -1.0 Observed and Simulated CO Cumulative Sensitivity Footprint for WKT for Sept 2006 Mid-Day (14:00 CDT). If footprint were rearranged in the shape of a circle: 50% within 838km 80% within1654km Simulated Fossil Fuel CO Locations of TEXAQS boundary layer profilers (lower case identifiers). Those outside of innermost domain are plotted in green. The closest radiosonde location (FWD) is shown in blue. NEI99 x (1/ 2.1) • FLEXPART-ECMWF was driven with 0.36x0.36meteorological fields, and STILT-WRF meteorology was nested down to 2kmx 2km. FLEXPART-GFS was driven by 1x1 met fields. • All three models capture the broad scale features of the CO time series, but miss some details. Interestingly, performance of FLEXPART-GFS is not substantially worse than for the higher resolution simulations. FLEXPART and STILT were developed and run completely independently, and yet the results are quite similar. • The NEI99 model was found to be too high by a factor of 2-3 compared to observations. This is consistent with other work (e.g., Turnbull et al., 2007). • Simulated fossil fuel CO2 is nearly identical when computed using the 0.1x0.1 Vulcan inventory (Gurney et al.) versus the 1x1 inventory used for CarbonTracker (Peters et al., 2007). • The implied emissions ratio for NEI99 CO versus Vulcan CO2 is 21 (ppb CO)/(ppm CO2). Our observations are consistent with an emissions ratio of 10- 12 (ppb CO)/(ppm CO2). *The CO background was calculated in the manner of Gerbig et al. (2003) using a climatological CO distribution from 1999-2000. An offset of 15 ppb was applied to match the lower envelope of the observations. Longitudinal variations were neglected. *Fire simulations were not available for STILT, so fire CO from the FLEXPART-ECMWF run was applied for comparison with observations. • Point source plumes are frequently observed at the tower, and are strongest at night. • The relative abundance of CO2, CO and O3 can help identify sources when considered along with back trajectories. • When trajectories from are from the southeast, we often see plumes with high CO. A likely source is the Alcoa smelter near Point Comfort, TX. • Trajectories from the east occasionally pass over large power plants and are characterized by high CO2with no detectable CO enhancement. • Results are from STILT-WRF/NEI99 simulation • According to this inventory (compiled by G. Frost and S. McKeen), Mexico does not contribute significantly to modeled fossil fuel CO pollution in central TX • The highest CO values occur under conditions of northerly flow, which accounts for the large contribution from North America beyond TX. For the same reason, Dallas/Fort Worth contributes more to modeled CO than Houston. • Waco, Killeen and Temple together account for ~7% of modeled CO. Tall-tower observations of pollution from near-field sources in central Texas during the Texas Air Quality Study 2006 A.E. Andrews1, E. Kort2, A. Hirsch3, J. Eluszkiewicz4, T. Nehrkorn4, A.M. Michalak5, A. Stohl6, G. Petron3, G. Frost3, K. Gurney7, S.C.Wofsy2, W.M.Angevine3, A.B. White1, S.J. Oltmans1, S.A. Montzka1, P.P. Tans1 1NOAA Earth System Research Laboratory, Boulder, CO; 2Harvard University, Cambridge, MA; 3Cooperative Institute for Research in Environmental Sciences, University of Colorado, Boulder, CO; 4Atmospheric and Environmental Research, Inc., Lexington, MA; 5University of Michigan, Ann Arbor, MI; 6Norwegian Institute for Air Research (NILU), Kjeller, Norway; 7Purdue, University, West Lafayette, IN ABSTRACT:The NOAA Earth System Research Laboratory has been measuring CO2, CO and basic meteorology from a television transmitter tower outside of Waco, TX since 2001. This site is identified in the NOAA network as WKT. Sample intakes are located at 30, 122 and 457 meters above ground level (magl). From July through November 2006, O3 measurements were added at 9 and 457 magl to support the Texas Air Quality Study (TexAQS 2006). There are several large point sources and metropolitan areas in the vicinity of the tower with distinct chemical signatures. Here, we evaluate the extent to which the Stochastic Time Inverted Lagrangian Transport (STILT) model reproduces pollution events that were observed at the tower during summer and fall 2006. For this study, STILT is driven by customized output from the WRF model v 2.2, which was run with a 2 km grid surrounding the tower embedded in a 10 km nest that covers most of the southern and eastern US and a 40 km nest that includes all of North America. Inaccurate representation of atmospheric transport is a major source of error in inverse estimates of fluxes of CO2 and other gases, and we selected this period for in depth analysis in part because a dense network of radar profilers was deployed for TexAQS 2006. The radar profilers report wind and boundary layer height, which can be used to evaluate the fidelity of the simulated transport. We have quantitatively compared the STILT-WRF results with similar output from the FLEXPART particle dispersion model driven by high-resolution ECMWF meteorology fields. We have used several different emissions inventories to evaluate model-to-model differences and differences between modeled and observed pollution influences. Sampling Footprints and Evaluation of STILT-WRF Transport Left: Radiosonde sites used in the WRF wind field verification. Locations plotted in red are only in the outermost domain (d01, 40km); green or blue locations are contained within domains (d02, 10km), those in blue are located within the 2km domains (d03, d04, and d05, 2km). Right: RMS error statistics for the 10km domain for Fall 2006 Measured and Modeled Time Series from STILT and FLEXPART and possible implications for air quality in central TX Point Source Plumes References Bakwin, P. S., P. P. Tans, D. Hurst and C. Zhao, (1998), Measurements of carbon dioxide on very tall towers: Results of the NOAA/CMDL program. Tellus, 50B, 401-415. Gerbig, C., J. C. Lin, et al. (2003). "Toward constraining regional-scale fluxes of CO2 with atmospheric observations over a continent: 1. Observed spatial variability from airborne platforms." Journal of Geophysical Research-Atmospheres108(D24). Gerbig, C., J. C. Lin, et al. (2003). "Toward constraining regional-scale fluxes of CO2 with atmospheric observations over a continent: 2. Analysis of COBRA data using a receptor-oriented framework." Journal of Geophysical Research-Atmospheres108(D24). Lin, J. C., C. Gerbig, et al. (2003). "A near-field tool for simulating the upstream influence of atmospheric observations: The Stochastic Time-Inverted Lagrangian Transport (STILT) model." Journal of Geophysical Research-Atmospheres108(D16). Peters, W., A. R. Jacobson, et al. (2007). "An atmospheric perspective on North American carbon dioxide exchange: CarbonTracker." Proceedings of the National Academy of Sciences of the United States of America104(48): 18925-18930. Turnbull, J. C., J.B. Miller, S. J. Lehman, P.P. Tans, R.J. Sparks, and J. Southton, (2006). Comparison of 14CO2, CO, and SF6 as tracers for recently added fossil fuel CO2 in the atmosphere and implications for biological CO2 Exchange, GRL, 33, L01817, doi:10.1029/2005GL024213. Trajectories for observed plumes from the TexAQS 2006 wind profiler network CO2 point sources COpoint sources CO/CO2 emissions ratios for observed plumes. For more information contact: Arlyn Andrews NOAA Earth System Research Laboratory Global Monitoring Division Arlyn.Andrews@noaa.gov Fall Meeting of the American Geophysical Union San Francisco, CA, 15-19 December 2008