Download
1 / 18
180 likes | 322 Views
Using Conceptual Models to Select Indicators for Monitoring Conditions on Rangelands Bob Breckenridge. October 20, 2003. Purpose.

E N D
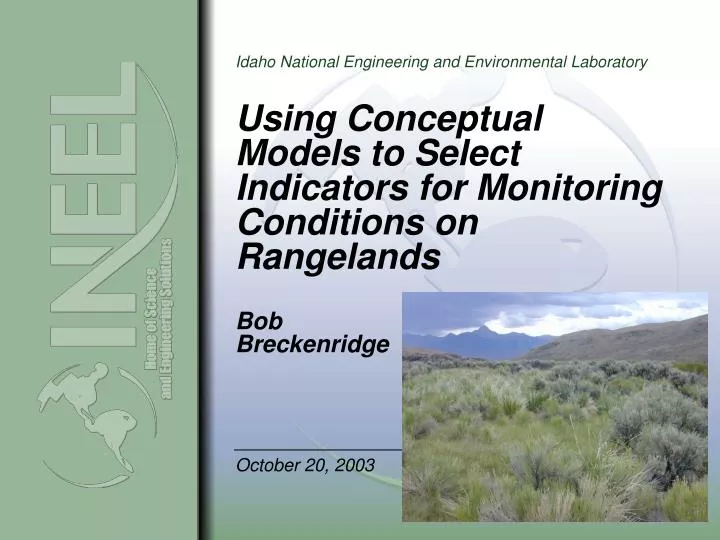
Using Conceptual Models to Select Indicators for Monitoring Conditions on RangelandsBob Breckenridge October 20, 2003
Purpose To use existing conceptual models from the literature, combined with field experience to address questions about the conditions of rangelands on appropriate temporal and spatial scales
TO ACCOMPLISH THIS: A set of selection criteria was developed and submitted to stakeholders for evaluation (e.g., weighting). PRODUCT: The outcome from this effort could be a consensus-driven approach useful for evaluating candidate indicators for assessing change to sensitive receptors and process that could be field tested.
Criteria for Indicator • Selection • Applicable and readily interpretable across different regions • Correlation with change in ecosystem process • Temporal and spatial variability • Best periods to sample (index period) • Ability to be quantified by synoptic or automated monitoring • Labor, eqiupment, analytical and data analysis costs
Criteria for Indicator Selection (continued) • Amount and quality of available data • Ability to assess shift between ecotones • Responsive/sensitive to change • Is anticipatory (has early warning potential) • Degree of environmental impact from sampling • Status of method • (established vs. experimental) • Cost-effectiveness
INDICATORS SELECTED Spectral properties – includes albedo and the Normalized Difference Vegetation Index (NDVI); measured using spectral reflectance and verified with ground measurements Vegetation composition, structure, and above ground biomass – includes leaf Area Index (LAI) as a measure of productivity Biogeochemistry – includes C:N:P ratio, soil, litter, and vegetation samples Energy balance – includes air temperature, monthly precipitation, Bowen’s Ratio, and Palmer Drought Severity Index (PDSI) for assessing energy balance
INDICATORS SELECTED Landscape patterns – description of the geometry of land cover patterns, I.e., fractal dimensions, patch size, and connectivity Water balance/water quality – includes conductivity, N,P,K organic carbon, alkalinity, and benthic macroinvertebrates. Water quantity – water balance on watershed and groundwater basin level, infiltration rates Retrospective index – developed using dendrochronology, PDSI records, pollen records, packrat middens, and charcoal records
INDICATORS SELECTED Fauna – includes the Breeding Bird Census, ants and ground beetle abundance, composition and distribution Erosion index – developed using soil loss values from wind and water loss equations Soil physical profile characteristics – includes surface and soil profile description and physical properties.
Figure 6. Soil interactions between key EMAP-Arid components.
Figure 9. Conceptual model showing how natural (rainfall intensity) and man induced (grazing pressure) stresses influence shifts from grassland ecosystems to shrubland in the Southwest U.S.
Figure 10. Indicator Development Process (Source: Barber, 1993)
Decision Analysis Using the Kepner-Tregoe (K-T) Process • Define decision statement in terms of “must” objectives (mandatory) and “want” objectives (desirable) • Weight the “want” objectives from most important to least (ID what matters most and what could be done without) • Evaluate alternative indicators against “must” (go/no go) and “want” criteria from best meets and score others relative to it (which best fulfills the criteria) • Evaluate consequences of alternatives (evaluate probability and seriousness) • Make final decision
Total Weighted Score for each Indicator Indicator Category Total weighted K-T score Spectral properties 750 Vegetation composition and cover 710 Energy balance (Bowen’s ratio) 676 Erosion index 628 Biogeochemistry 625 Landscape patterns 620 Retrospective 511
EMAP-Arid Indicator Categories Spectral Reflectance (NDVI, Albedo) Vegetation Composition, Abundance, and Structure (LAI, HLI) Energy Balance (Bowen’s Ratio, APAR) Erosion Index (WEPP, RUSLE) Biogeochemistry (C:N:P Ratios) Landscape Ecology (Fractal Dimension) Water Balance (Infiltration Rate) Faunal (Species Richness, Trophic Structure)
Figure 4. Detailed conceptual models were used to show how ecosystem indicator categories could be selected.