Download
1 / 24
240 likes | 321 Views
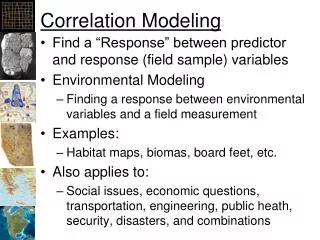
Modeling and clustering disease progression for correlation with genetic and demographic factors. Robert Kingan. What is SSIFT?.

E N D
Modeling and clustering disease progression for correlation with genetic and demographic factors Robert Kingan
What is SSIFT? • “To address […] common diseases, which include schizophrenia, depression, and breast cancer, it is essential to incorporate observations of the clinical progression of the disease to refine the definition of phenotype.” – Michael N. Liebman, U. Penn. • Yes, but what is SSIFT? • SSIFT = Stratification and Synchronization Inference Technology
What is SSIFT? • Stratification: Dividing a patient population into groups which are meaningful for diagnosis, prognosis, treatment selection, or genotype-phenotype correlation. • Synchronization: Recognizing a pattern of disease progression, regardless of disease stage for a particular patient.
SSIFT overview • Assumptions—what is SSIFT-able • Other constraints on data selection • Outline of technique • Identifying variables • Modeling disease progression • Parameterizing different models • Clustering patients by progression patterns • Interpreting the results
period of change final value Disease marker initial value Time Pattern of disease progression
SSIFT workflow Survey the data Construct feature vectors Assign feature weights Select useful variables Cluster weighted feature vectors Fit disease progression models Evaluate the clustering results Complete? No Yes
SSIFT workflow SSIFT
Converting parameters y* = population mean, t1=first time point, tn=last time point
Survey the data Construct feature vectors Assign feature weights Select useful variables Cluster weighted feature vectors Fit disease progression models Evaluate the clustering results Complete? No Yes SSIFT workflow
SSIFT workflow Survey the data Construct feature vectors Assign feature weights Select useful variables Cluster weighted feature vectors Fit disease progression models Evaluate the clustering results Complete? No Yes • Correlate results with: • demographic data • genetic data
Application of SSIFT to NIDDK • About NIDDK • SSIFT and transplant data • Variable selection • Modeling • Results
-Fetoprotein Albumin Alkaline phosphatase (AP) Bicarbonate Blood urea nitrogen (BUN) Calcium Creatinine clearance Cholesterol Chlorine Corrected PT control Creatinine Direct bilirubin FK506 level Glomerular filtration rate Gamma GTP Glucose Hematocrit (HCT) Hemoglobin CSA HPLC level Potassium CSA monoclonal level Sodium Platelet count Prothrombin time Part. thromboplastin CT Part. thromboplastin PT CSA RIA level SGOT (AST) SGPT (ALT) Total bilirubin CSA TDX level Total protein White blood cells (WBC) Weight in KG Candidate variables
Final selected variables • Best pair: AST + AP, Ŝ=0.34 • Best triple: AST + AP + hematocrit, Ŝ=0.42 • No set of four variables exceeded Ŝ=0.42
Survival by clustered SSIFT AST, AP and HCT parameters Ŝ = 0.42
Best cluster Worst cluster Cluster mean curves
SSIFT™ Discover Analyze Markers Time Determine Disease Genes Disease Progression Pattern SSIFT in Gene Discovery: Simulation
Simulated data Marker Value (relative scale) Time (years)
Nearest-Neighbor Analysis 555555566666666666645526566351142222222222224412114442333333333344344 C2353 is related to SSIFT pattern of disease progression (p<10-41 ).
SSIFT: Stratification and Synchronization Inference Technology Discussion