Download
1 / 2
20 likes | 106 Views
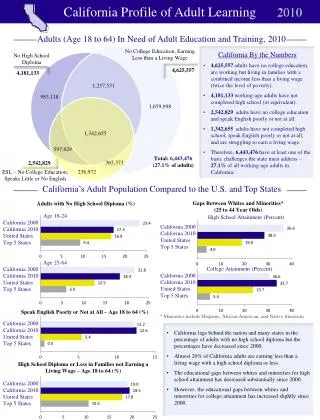
2010. Iowa Profile of Adult Learning. Adults (Age 18 to 64) In Need of Adult Education and Training, 2010. No College Education, Earning Less than a Living Wage. Iowa By the Numbers

E N D
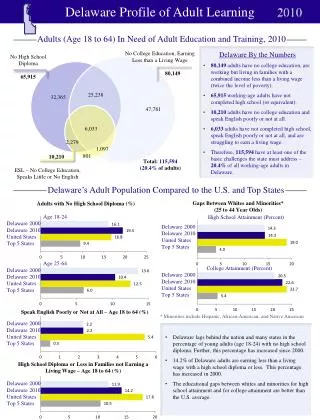
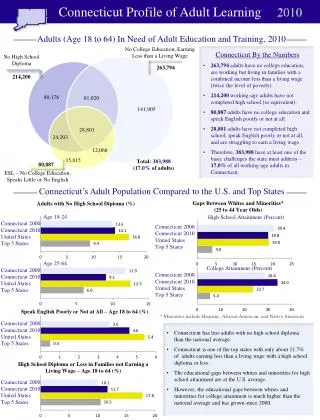
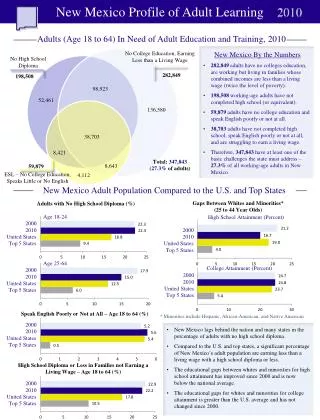
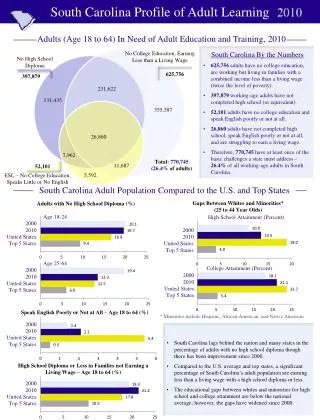
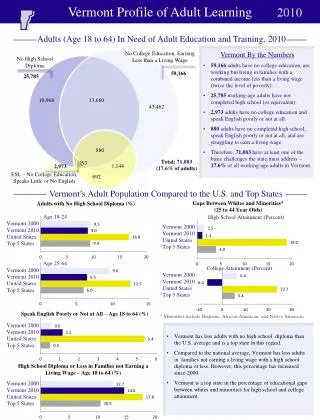
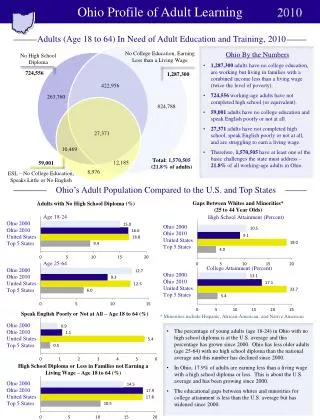
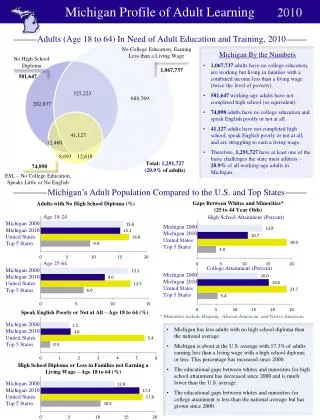
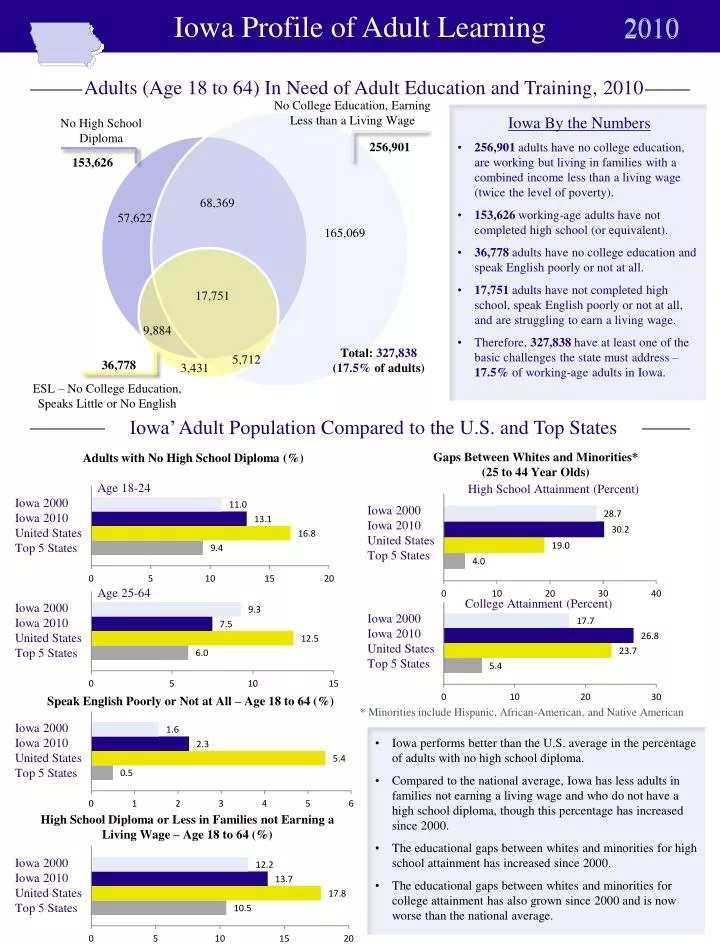
2010 Iowa Profile of Adult Learning Adults (Age 18 to 64) In Need of Adult Education and Training, 2010 No College Education, Earning Less than a Living Wage • Iowa By the Numbers • 256,901 adults have no college education, are working but living in families with a combined income less than a living wage (twice the level of poverty). • 153,626 working-age adults have not completed high school (or equivalent). • 36,778 adults have no college education and speak English poorly or not at all. • 17,751 adults have not completed high school, speak English poorly or not at all, and are struggling to earn a living wage. • Therefore, 327,838 have at least one of the basic challenges the state must address – 17.5% of working-age adults in Iowa. No High School Diploma 256,901 153,626 68,369 57,622 165,069 17,751 9,884 Total: 327,838(17.5% of adults) 5,712 36,778 3,431 ESL – No College Education, Speaks Little or No English Iowa’ Adult Population Compared to the U.S. and Top States Gaps Between Whites and Minorities* (25 to 44 Year Olds) Adults with No High School Diploma (%) Age 18-24 High School Attainment (Percent) Iowa 2000 Iowa 2000 Iowa 2010 Iowa 2010 United States United States Top 5 States Top 5 States Age 25-64 College Attainment (Percent) Iowa 2000 Iowa 2000 Iowa 2010 Iowa 2010 United States United States Top 5 States Top 5 States Speak English Poorly or Not at All – Age 18 to 64 (%) * Minorities include Hispanic, African-American, and Native American Iowa 2000 Iowa 2010 • Iowa performs better than the U.S. average in the percentage of adults with no high school diploma. • Compared to the national average, Iowa has less adults in families not earning a living wage and who do not have a high school diploma, though this percentage has increased since 2000. • The educational gaps between whites and minorities for high school attainment has increased since 2000. • The educational gaps between whites and minorities for college attainment has also grown since 2000 and is now worse than the national average. United States Top 5 States High School Diploma or Less in Families not Earning a Living Wage – Age 18 to 64 (%) Iowa 2000 Iowa 2010 United States Top 5 States
Prepared by the National Center forHigher Education Management Systems With Support from the Bill and Melinda Gates Foundation 2010 Iowa Profile of Adult Learning Reaching the Target Population Enrollment per 1,000 Adults Age 18-64: College Participation of Adults Age 25-49 as a Percent of Population Age 25-49 with Only a High School Diploma In State-Administered ABE Programs with Less than a High School Diploma Iowa 2001 Iowa 2000 Iowa 2009 Iowa 2010 United States United States Top 5 States Top 5 States In English as a Second Language (ESL) with Little or No English Proficiency • Adult enrollment in state-administered ABE and ESL programs is lower than the U.S. average and the performance of the top five states. • The number of GEDs awarded per 1,000 adults in Iowa has decreased since 2000. • The overall college participation rate of adults ages 25-49 is slightly lower than the national average, though it has improved since 2001. Iowa 2000 Iowa 2010 United States Top 5 States GEDs Awarded per 1,000 Adults with Less than a High School Diploma (Age 18 to 24) Iowa 2000 Iowa 2010 United States Top 5 States The Benefits of More Education Workforce Participation (%) Education Median Annual Earnings (Age 18 to 64) Less than High School • Adults with higher levels of education are more likely to participate in the workforce than adults with less than a college degree. • Additionally, those with a college degree earn substantially more money annually compared to those with less than a college degree. High School Some College Associates Degree Bachelor’s Degree Graduate/Prof. Degree Sources: U.S. Census Bureau, American Community Survey – Public Use Microdata Files, 2000, 2010 Office of Vocational and Adult Education NCES, IPEDS Fall 2000 and 2010 Enrollment Files General Education Development (GED) Testing Service, 2001, 2010