Download
1 / 14
140 likes | 251 Views
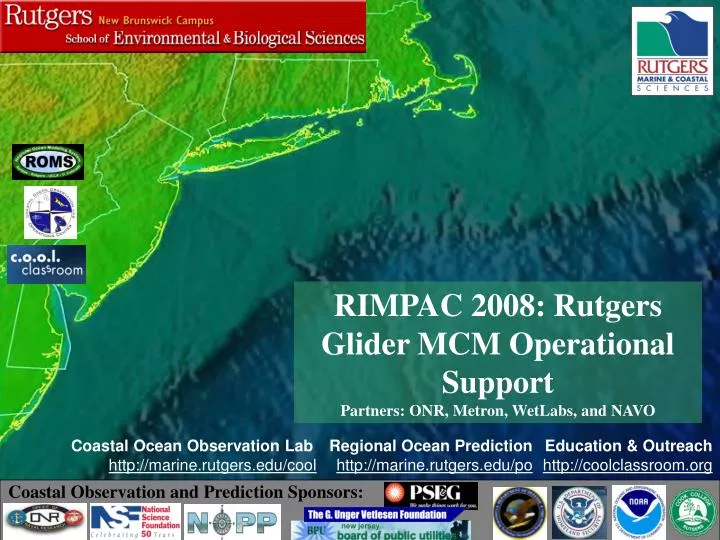
RIMPAC 2008: Rutgers Glider MCM Operational Support Partners: ONR, Metron, WetLabs, and NAVO. Coastal Ocean Observation Lab http://marine.rutgers.edu/cool. Regional Ocean Prediction http://marine.rutgers.edu/po. Education & Outreach http://coolclassroom.org.

E N D
RIMPAC 2008: Rutgers Glider MCM Operational Support Partners: ONR, Metron, WetLabs, and NAVO Coastal Ocean Observation Lab http://marine.rutgers.edu/cool Regional Ocean Prediction http://marine.rutgers.edu/po Education & Outreach http://coolclassroom.org Coastal Observation and Prediction Sponsors:
Rutgers University(Largely support) • Provided 3-100m Slocum Coastal Electric Gliders to NAVOCEANO • On-site logistical support in case of emergency recoveries/redeployments • Off-site support for NAVOCEANO (glider configurations, science payload sampling, etc.) • QA/QC and dissemination of Inherent Optical Properties (IOPs): • bb(λ): Optical backscatter (470, 532, 660nm) • c(λ): : Optical attenuation (532nm) • NAVOCEANO took the lead on Slocum glider field operations
The Slocum Coastal Electric Glider Science Bay Specs. Length: 30 cm Diameter: 21.3 cm Max. Payload Weight: 4 kg Glider Specs. Length: 1.5 m Hull Diameter: 21.3 cm Weight: 52 kg
Science Payload Sensors(Modular, Swapable) • CTD – hydrography (Temperature, Salinity, Density) • Optical Sensors – • Eco bb3 pucks (blue, green and red light backscattering) • AUVB (green light attenuation)
Traditional Glider Piloting/Visualization Software and Data Flow Tactical Decision Aids
RIMPAC 2008 Glider Piloting/Visualization Software and Data Flow Tactical Decision Aids
Glider MCM Operations Summary: Penguin Banks (5 Deployments) sl113 (NAVOCEANO): 6/28/2008 – 7/26/2008 sl114 (NAVOCEANO): 6/28/2008 – 7/26/2008 ru05 (Rutgers): 7/07/2008 – 7/12/2008 ru05 (Rutgers): 7/18/2008 – 7/26/2008 ru16 (Rutgers): 7/03/2008 – 7/24/2008
Deployment Totals:5 deployments90 in-water glider days1533km flown> 10,000 profiles RU05: July 7, 2008 – July 12, 2008 Payload: CTD, OCR-504I, Eco bb puck Duration: 5 days Distance Traveled: 112km Profiles: 1150 RU05: July 18, 2008 – July 26, 2008 Payload: CTD, OCR-504I, Eco bb puck Duration: 8 days Distance Traveled: 131km Profiles: 482 RU16: July 3, 2008 – July 24, 2008 Payload: CTD, AUVB, Eco bb puck, Eco fl puck Duration: 21 days Distance Traveled: 500km Profiles: 4896 SL113: June 28, 2008 – July 26, 2008 Payload: CTD, AUVB Duration: 28 days Distance Traveled: 367km Profiles: 2136 SL114: June 28, 2008 – July 26, 2008 Payload: CTD, AUVB Duration: 28 days Distance Traveled: 423km Profiles: 1962
How Does this Array/Sampling Regime Help Visual the Battlespace?
Glider/Software Issues • Glider Configuration: • Payload configurations: • Instrument specific calibration coefficients for some instruments reside on the glider • Other instruments require application of calibration coefficients on shore and further processing. • Sampling configurations: • Flight controller is heavily burdened with flight, navigation and communication priorities • Glider sampling directives must be fine tuned to achieve optimum data collection. • FUTURE: all science data logged on science controller, which should eliminate many (if not all) of these issues. • Shore-Side Processing: • FTP of raw glider data files to Rutgers • Processing at Rutgers • FTP profile data back to NAVOCEANO/NRL Long data pipelines = lag time between measurement and application of measurement for MCM operations!
Field Issues • Working across 5 timezones – lag between when you want something done and when it is actually done! • Damage as a result of Deployment/Recovery in heavy seas • Final Data Collection (making sure all data is shore-side before wiping flash cards)
What Did We Achieve? • Successful transfer of AUV control from Rutgers University to NAVOCEANO for 24-hour Operations • Successful characterization of the Operational Area using a fleet of AUVs deployed outside the area of interest
Future Recommendations • NAVOCEANO – more deployments, more deployments, more deployments! • Shore-side data QA/QC (NAVOCEANO, NRL?) • Data visualization tools (TWRC, NAVOCEANO, NRL?)