Download
1 / 42
450 likes | 571 Views
Adhesion and phase separation in mixed-lipid membranes: steps toward a better experimental model. Vernita D. Gordon, University of Texas at Austin. Membranes are important for:. Biophysics Interface of cell and environment Physics Rich model systems for interactions and transitions

E N D
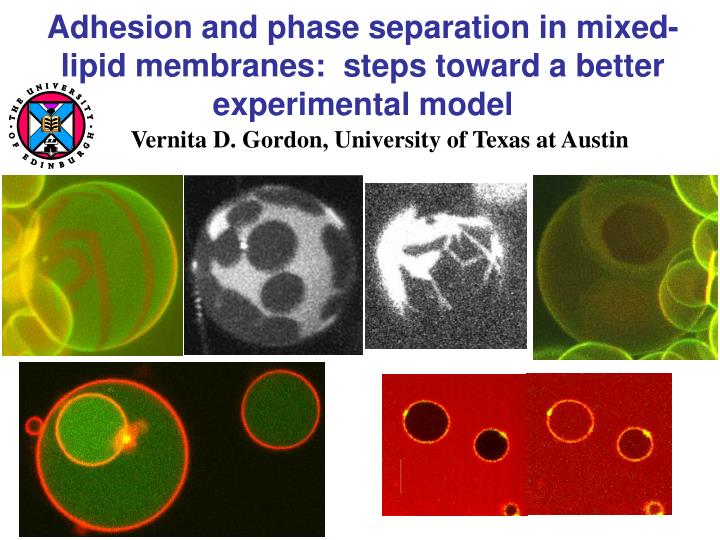
Adhesion and phase separation in mixed-lipid membranes: steps toward a better experimental model Vernita D. Gordon, University of Texas at Austin
Membranes are important for: • Biophysics • Interface of cell and environment • Physics • Rich model systems for interactions and transitions • Novel couplings of statistical mechanics & elasticity • soft to perturbations caused by kBT • Biotechnology • Controlled encapsulation and delivery • Artificial cells created by synthetic biology Michael Edidin (2003)
Model systems reduce rich lipid compositions 1000s of different lipid species Michael Edidin (2003) Nature Reviews Molecular Cell Biology 4, 414-418 Phospholipids Structure from LIPIDAT xx == hydrophobic tail saturation and length y == hydrophilic headgroup Lipid names: xxPy
Lipid amphiphilicity + aqueous solution self-assembled structures bilayer water water membrane vesicle hydrophilic hydrophilic ~10 mm = Giant Unilamellar Vesicle (GUV) hydrophobic
Lipids in simple model bilayers form a variety of solid-like phases La P′ II bend ~10 stiffer temperature L P′ L′ and others
In model bilayers containing cholesterol, lipids form different liquid phases Ld La = cholesterol temperature Lo bend ~2 stiffer L′ L and others P′
Models: Giant Unilamellar Vesicles (GUVs) containing preferentially-partitioning fluorescent dyes Each image = projection of upper or lower hemisphere Most ordered phases exclude dyes as impurities: For Pb′, dyes partition complementarily: Rh-DPPE or DiI-C-18 BODIPY (Dyes are ~0.5 mol% of system composition.)
cells adhere to the extracellular environment nutrients and pathogens interact with and enter cells Membrane adhesion essential in biology rafts and caveolae. http://publications.nigms.nih.gov/insidethecell/chapter2.html Lo
Adhesion favors demixing and localizes ordered phases Fluid-ordered domains Pb′ II hexagonaldomains (in 3 different lipid mixtures with the same headgroup) Pb′ “red” domains VDG, M Deserno, et al, 2008 Europhysics Letters 84:48003
Undulations favour mixing Systems demix when this reduces their free energy (U – TS) Treat a membrane as a collection of classical oscillators, each with spring constant and free energy kbendq4 Toy Case: For a membrane with 2 components, A:B 1:1, complete demixing changes the undulation contribution to the free energy of demixing by Integrating over all oscillator modes gives If disordered (soft) AB mixture demixes into disordered A and ordered B, moduli are Fluid-ordered a ~ 2 Solid-like a ~ 10 Undulations favour mixing Suppressing undulations favours demixing
Confining the membrane suppresses fluctuations Approximate adhesion as a confining, harmonic potential Classical oscillators comprising the membrane have new spring constants Previous Toy Case: completely-demixed AB membrane with confinement has a change in the free energy of demixing where For a ~ 10, at room temperature, effect of confinement ~ 1% or 3K VDG, M Deserno, et al, 2008 Europhys Letts, 84:48003
Implications for biological & biotechnological structures Raft localization, growth, stabilization Functional vesicles Unbound, fluctuating, fluid-phase membrane Specifically adhering, fluctuations suppressed, solid-phase membrane vesicle Membrane binder Molecular target
Steps toward this vision: Unbound, fluctuating, fluid-phase membrane Specifically adhering, fluctuations suppressed, solid-phase membrane vesicle Membrane binder Molecular target
Scheme for specifically adhering membranes Figure from Fenz, S.F., R. Merkel and K. Sengupta. Langmuir, 2009. 25: p. 1074-1085.
Specific adhesion in our lab • Non-adhering vesicles drift. • Adhering vesicles do not drift.
Specific adhesion in our lab t=0 t=10 minutes
Plan of action: • Measure effect of adhesion on phase separation • Area fraction of ordered phase • Transition temperature • Measure effect of adhesion on fluctuations • Correlate • Vary: • Stiffness of ordered phase • Binder properties
Strategy for measuring effect of adhesion on phase separation • Work from known phase diagrams, very near the demixing boundary • Binary system: DOPC-DPPC • Solid-like ordered phase • Ternary system: DOPC-DPPC-cholesterol • Fluid-like ordered phase • Incorporate trace amounts of binders, PEG, and fluorescent dye • Measure area fractions of ordered phase • Specifically-adhering vs non-adhering vesicles • Measure transition temperature • Specifically-adhering vs non-adhering vesicles
Steps toward this • Vesicles that incorporate binders, PEG, and dye show the right phase separation • Good yields of unilamellar, isolated vesicles • Good supported bilayers to provide targets for binding
Strategy for measuring effect of adhesion on fluctuations • Measure fluctuations in membranes • Specifically-adhering vs non-adhering • Begin with non-phase-separating, fluid membranes • Advance to phase-separating membranes
Microscopy techniques to study adhesion and fluctuations Total internal reflection fluorescence Reflection interference (can be developed into reflection interference contrast)
Calibrating TIRF measurements d=λo/4π(n22sin2θ-n12)-1/2 d=Iz/e length for evanescent wave (penetration depth) λo= excitation wavelength (532 nm for the setup) n2 = index of refraction of coverslip (~1.52) n1 = index of refraction of buffer (~1.34) θcritical= sin-1(n1/n2)= 1.08 rad θ= angle of incidence Thanks to Prof. George Shubeita (UT Austin) and his group!
Binder concentration may make a difference Low concentration of neutravidin High concentration of neutravidin
Image processing and analysis Correct for: Lateral drift Photobleaching/z-drift Background noise
Correcting for lateral drift • Center of mass should stay in the same place
Correcting for photobleaching/z-drift Remove trends in pixel brightness
Correcting for background noise Measure noise for SLB alone, no vesicles
Final corrected image Instead of
Measuring membrane fluctuations Specifically-adhering membrane Dh(x,y,t) = h(x,y,t) - <h(x,y)> RMS displacement measured: ~13nm 13.198nm for a large region 13.283nm for a smaller region
DOPC:DPPC + cholesterol • Phase behavior characterized by S. Keller and S. Veatch, U. Washington, Seattle • Standing on the shoulders of giants • Transition temperatures and phase diagram • At sufficient cholesterol concentrations, this system has fluid-fluid phase separation • DOPC:DPPC 1:1 + 42mol% or 45mol% cholesterol
Experimental strategy • Prepare a sample of DOPC:DPPC:cholesterol + trace amounts of biotin, PEG, fluorophores Measure area fraction of ordered phase in specifically-adhering versus non-adhering membranes
Early experimental images Most membranes show no phase separation If we’re careful about how we load the sample, a few membranes do show phase separation right at the adhering bottom
Adhesion decreases the fraction of membranes that phase separate 42 mol% cholesterol: 28% of specifically-adhering membranes phase separate 42% of non-adhering membranes phase separate ~40 membranes/sample For those membranes with ordered phase at the adhering area, area fraction of ordered phase at the adhering area: specifically-adhering, 0.59 non-adhering, 0.68 ~10 membranes/sample This is the opposite of what we expected. Are we crazy?
New working hypothesis • We are not completely crazy. • Adhesion can do more than one thing: • Suppress fluctuations • Tense the membrane • If tension stretches the membrane enough to dilate area/headgroup, could that suppress phase separation? • Could be 2 regimes of phase separation interacting with adhesion
Plan from here: • Test the new working hypothesis: • If the adhering area is low: • membrane fluctuations suppressed • ordered phase promoted • If the adhering area is high: • membrane tension dilates area/headgroup • Ordered phase suppressed
Another richness that could arise: • Preference of the binder for one phase over another
Summary • Suppressing fluctuations alters demixing behavior • We want to use this to understand the cell membrane and to make functional membranes that combine targeting and triggering.
Thank you • You • (UT Austin) Matthew Leroux, Matthew Preble, Nabiha Saklayen; Jeanne Stachowiak (BME); George Shubeita (Physics) • (Edinburgh) Paul Beales, Markus Deserno, Wilson Poon, Stefan Egelhaaf • EPSRC
Advertisment • Postdoc to work on a bacteria experiment: how does spatial structure develop in biofilms, and how does this impact cooperation? • This 4-investigator collaboration is funded by the Human Frontiers Science Project and is a great opportunity to train across disciplines. • gordon@chaos.utexas.edu