1 / 4

Hi Emily – This is set 4 of our detailed slides.

Hi Emily – This is set 4 of our detailed slides. . This pie chart is based on 2010 data (in kWh) from Nilmini. Nilmini said (Friday, October 11) that it will not be possible to get this data for 2050. . Chart could be shown with legend (as done on this slide). .

aleda
Download Presentation

Hi Emily – This is set 4 of our detailed slides.

An Image/Link below is provided (as is) to download presentation Download Policy: Content on the Website is provided to you AS IS for your information and personal use and may not be sold / licensed / shared on other websites without getting consent from its author. Content is provided to you AS IS for your information and personal use only. Download presentation by click this link. While downloading, if for some reason you are not able to download a presentation, the publisher may have deleted the file from their server. During download, if you can't get a presentation, the file might be deleted by the publisher.

E N D

Presentation Transcript


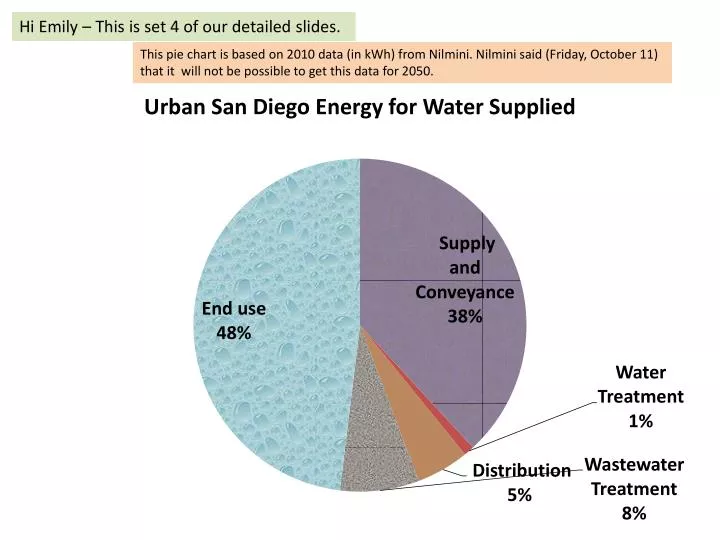
  1. Hi Emily – This is set 4 of our detailed slides. This pie chart is based on 2010 data (in kWh) from Nilmini. Nilmini said (Friday, October 11) that it will not be possible to get this data for 2050.

  2. Chart could be shown with legend (as done on this slide).

  3. This 2012 data was provided by Nilmini. I have contacted her so she can check if she can get data for 2050.

  4. Heatwaves 1985 2 days 2013 Heatwaves get warmer 3 days 2050 6 days Heatwaves get longer

More Related