Download
1 / 65
650 likes | 801 Views
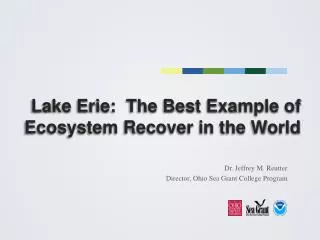
Understanding the Lake Erie Ecosystem: Current Status and Outlook for the Future . Dr. Jeffrey M. Reutter Director, Ohio Sea Grant College Program. Jeffrey M. Reutter, Ph.D., Director. 1895—F.T. Stone Laboratory 1970—Center for Lake Erie Area Research (CLEAR)

E N D
Understanding the Lake Erie Ecosystem: Current Status and Outlook for the Future Dr. Jeffrey M. Reutter Director, Ohio Sea Grant College Program
Jeffrey M. Reutter, Ph.D., Director • 1895—F.T. Stone Laboratory • 1970—Center for Lake Erie Area Research (CLEAR) • 1978—Ohio Sea Grant College Program • 1992—Great Lakes Aquatic Ecosystem Research Consortium (GLAERC) • Grad student at Stone Lab in 1971 and never left. Director since 1987.
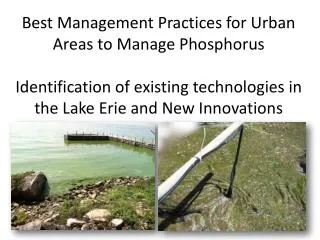
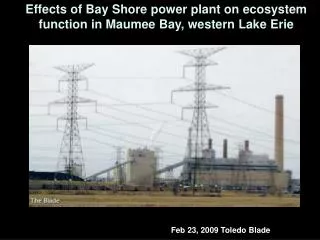
Historical Trends:The Lake Erie Ecosystem 1969—Cuyahoga River burns Getting worse annually to 1970 Stable 1970-75 Improving 1975-1995 1995+ Getting worse Photo: Ohio Sea Grant
Lake Erie: One of the Most Important Lakes in the World Dead lake image of 60s and 70s. Poster child for pollution problems in this country. But, most heavily utilized of any of the Great Lakes. Shared by 4 states, a province, and 2 countries. Best example of ecosystem recovery in world.
Southernmost Image: Ohio Sea Grant
Because of Land Use, Lake Erie Gets: More sediment More nutrients (fertilizers and sewage) More pesticides (The above 3 items are exacerbated by storms, which will be more frequent and severe due to climate change.) And Lake Erie is still biologically the most productive of the Great Lakes—And always will be!!
50:2 Rule (Not exact, but instructive) Lake Superior: 50% of the water and 2% of the fish Lake Erie: 2% of the water and 50% of the fish
80:10:10 Rule • 80% of water from upper lakes • 10% direct precipitation • 10% from Lake Erie tributaries • Maumee • Largest tributary to Great Lakes • Drains 4.5 million acres of ag land • 3% of flow into Lake Erie
Lake Erie Stats Drinking water for 11 million people Over 20 power plants Power production is greatest water use 300 marinas in Ohio alone Walleye Capital of the World 40% of all Great Lakes charter boats Ohio’s charter boat industry is one of the largest in North America $1.5 billion sport fishery One of top 10 sport fishing locations in the world The most valuable freshwater commercial fishery in the world Coastal county tourism value is over $11.5 billion
Lake Erie’s 7 Biggest Problems/Issues (see Twine Line, Spring/Summer, 2012 Sedimentation Phosphorus and nutrient loading Harmful algal blooms Aquatic invasive species Dead Zone Climate Change—Makes the others worse Coastal Economic Development
Nutrients: Problem or Benefit? On our lawns, they make our grass grow In water, they make algae and plants grow Lake Erie is most productive Great Lake because: shallowest, warmest, and most nutrients. But it is possible to have too much of a good thing. Too much P leads to too much algaeand the wrong kinds of algae
Algae are tiny plant-like organisms that live in water There are hundreds of species of algae in Lake Erie. Most are beneficial. • Source: Tom Bridgeman, UT
Major groups/kinds in Lake Erie Diatoms Greens Blue-greens (Cyanobacteria) • Source: Tom Bridgeman, UT
Lake Erie Poster child for pollution problems when Cuyahoga River burns in 1969 To “walleye capital of the world” in mid-1980s Best example of ecosystem recover in world
What brought about the rebirth (dead lake to Walleye Capital)? Phosphorus reductions from point sources (29,000 metric tons to 11,000);and agriculture helped!
Impact of Ecosystem Recovery (rebirth) Ohio walleye harvest 112,000 in 1976 to over 5 million by mid-80s 34 charter fishing businesses in 1975 to over 1200 by mid-80s and almost 800 today 207 coastal businesses to over 425 today
Blue-green Algae Bloom circa 1971, Lake Erie Photo: Forsythe and Reutter
Why did we target phosphorus? Normally limiting nutrient in freshwater systems P reduction is best strategy ecologically and economically Reducing both P and N would help
Impacts of Increased Phosphorus Concentrations • HABs—If P concentrations are high (regardless of the source, Ag, sewage, etc.) and water is warm, we will have a HAB (nitrogen concentration will likely determine which of the 6-7 species bloom) • Nuisance Algae Blooms • Cladophora—Whole lake problem. An attached form. • Dead Zone in Central Basin
Cyanobacteria in Lake Erie Microcystis Anabaena Aphanizomenon • Source: Tom Bridgeman, UT
Phosphorus Sources • 1960s and 70s—primarily point sources (2/3) • Today loading is coming primarily from agriculture (2/3) but other sources include: • Sewage treatment plants and CSOs • Lawn fertilizer runoff • Water treatment plants • Septic tanks
Are HABs only a Lake Erie and Ohio Problem? Global problem Serious problem in US and Canada Common species in Lake Erie is Microcystis sp. Dominant form in Grand Lake St. Marysin 2010 was Aphanizomenon sp., the same species that bloomed in Lake Erie in the 60s and 70s
Grand Lake St. Marys July 2010
Microcystin Concentrations 1 ppb WHO drinking water limit 20 ppb WHO swimming limit 60 ppb highest level for Lake Erie till 2011 84 ppb highest level for Grand Lake St. Marys till 2010 2000+ Grand Lake St. Marys 2010 1200 Lake Erie Maumee Bay area 2011
Nutrient Loading Majority of loading occurs during storm events 80-90% of loading occurs 10-20% of time 2012 = dry spring and low load—a very good thing!!
Microcystis, Stone Lab, 8/10/10 Photos: Jeff Reutter
August 11 2011 1330 cfs Photo: NOAA Satellite Image
October 9, 2011 Photo: NOAA Satellite Image
Microcystis near Marblehead October 9, 2011 Photo: Richard Kraus, United States Geological Survey
Microcystis in Lake Erie • The Microcystis-Anabaenabloom of 2009 was the largest in recent years in our sampling region • …until 2011 Source: Tom Bridgeman, UT 2011
Climate change is making these problems worse! • Warm water favors HABs • Warm water increases oxygen depletion rates • More severe storms will resuspend more sediment and increase erosion and nutrient loading • Critically important point—with no changes in Ag practices, warmer weather and increased frequency of severe storms could increase negative impact of existing practices. • Lake levels—uncertain/probably down
Increased Frequency of Rainstorms Changes in frequencies of storms in the Midwest, by category of storm size for five decades, 1961-1970 through 2001-2010. Labeled changes are for the last decade. Comparisons are to frequencies in 1961-1990. Source: Rocky Mountain Climate Organization and Natural Resources Defense Council.
NOAA HAB Forecast--2012 • Loading from March through June is critical point • Drought leads to low rainfall and runoff • Heidelberg data shows loads lowest in 40 years • UT data show Maumee Bay concentrations less than 1/10 of 2011 • Therefore, 2012 bloom will be less than 10% of 2011 bloom in Western Basin and similar to 2007.
Microcystis in Lake Erie Source: Tom Bridgeman, UT Justin Chaffin, Ohio Sea Grant and Stone Lab
Target Loads to Solve Problem Leading subcommittee of the Ohio Phosphorus Task Force to identify both spring and annual target loads of both total P and DRP to prevent or greatly reduce HABs
HABs:Western Basin Problembut Contribute to Oxygen Demand inthe Central Basin, i.e.the Dead Zone
Lake Erie Cross Section Image: Ohio Sea Grant
AIS: Zebra/Quagga Mussels & Round Gobies Photo: Ohio Sea Grant
Because Lake Erie is the southernmost, shallowest, warmest, and most nutrient-enriched of the Great Lakes, it is likely that AIS will always present the greatest problem, and have the greatest impact, in Lake Erie.