Download
1 / 13
130 likes | 266 Views
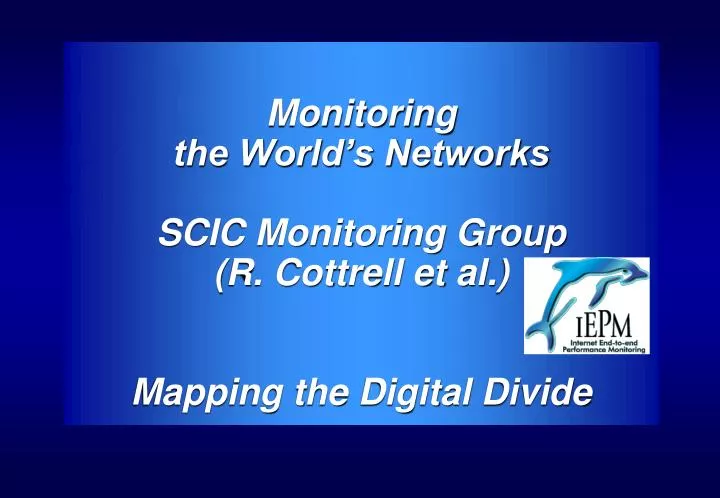
Monitoring the World’s Networks SCIC Monitoring Group (R. Cottrell et al.) Mapping the Digital Divide. Digital Divide: North Vs. South East Vs. West. Plots Courtesy the PingER Project. Data from http://internetworldstats.com. Work on the Digital Divide from Several Perspectives.

E N D
Monitoring the World’s NetworksSCIC Monitoring Group (R. Cottrell et al.) Mapping the Digital Divide
Digital Divide: North Vs. South East Vs. West Plots Courtesy the PingER Project Data from http://internetworldstats.com
Work on the Digital Dividefrom Several Perspectives • Share Information: Monitoring, Tracking BW Progress; Dark Fiber Projects & Pricing • Track Planning (focus on LHC) and Leading Edge Progress • Model Cases: Poland, Slovakia, Czech Rep., Brazil, China … • Encourage Access to Dark Fiber; Modern technology choices • Raise Awareness: Locally, Regionally & Globally • Digital Divide Workshops • Diplomatic Events: WSIS, RSIS, Bilateral: US-South Asia, EU-Africa,… • Technical Help with Modernizing the Infrastructure: • Provide Tools for Effective Use: Data Transport, Monitoring, Remote Collaboration and e-Learning • Design, Commissioning, Development • India “Knowledge Network”, Brazil’s Nat’l and Int’l Networks • Encourage, and Work on Inter-Regional Projects • GLORIAD, Russia-China-Korea-US-Europe Optical Ring • Latin America: CHEPREO/WHREN (US-Brazil); RedCLARA • Mediterranean: EUMEDConnect; Asia-Pacific: TEIN2; Asia: ORIENT
SCIC Monitoring WG PingER (Also IEPM-BW) R. Cottrell Monitoring & Remote Nodes (10/2010) • Measurements from 1995 On Reports link reliability & quality • Countries monitored • Contain 98% of world pop. • 99% of World’s Internet Users • 930 remote nodes at 786 sites in 164 nations; 55 monitoring nodes;169 nodes in 50 African countries • Strong Collaboration with ICTP Trieste and NUST/SEECS (Pakistan) • Excellent, Vital Work; Funding issue Countries:N. America (3), Latin America (21),Europe (30), Balkans (10),Africa (50), Middle East (13), Central Asia (9),South Asia (8), East Asia (4), SE Asia (10),Russia (1),China (1)andOceania (4)
Number of Hosts Monitored By Region: 1998 - 2009 R. Cottrell Latin America Africa
Loss Quality Vs. Population in 2008 vs. 2001) 2001 In 2001, only ~20% of the world had an Acceptable or Better Packet Loss Rate [49% unmeasured]. By 2008 this had improved to ~90%. What matters as much now is throughput. R. Cottrell
SCIC Monitoring WG – Throughput improvements 1998-2010 Mar ‘92 Top 4: Europe, N. America, E, Asia & Australasia, Behind Europe: 5yrs: Russia, L, America, Mid East. 8yrs: SE Asia 13yrs: S. Asia, C. Asia 18yrs: Africa Derived TCP Throughput = 1460Bytes*8bits/Byte/(RTT * sqrt(loss)) Mathis et. al. In 10 years: Russia and L. America should catch up with top 4. Africa falling further behind, factor 60 behind E. Asia
Accomplishments Since 2008 • We have extended the measurements to cover more developing countries and to increase the number of hosts monitored in each developing country. • We have carefully evaluated the routes and minimum ping RTTs to verify that hosts are where they are identified to be in our database. As a result we have worked with contacts in relevant countries and sites to find alternatives, and about 20-30 hosts have been replaced by more appropriate hosts. • Since December of 2006, we have added a net of over 230 new remote hosts, and added 51 countries (Africa: BF, CD, CV, CI, DJ, GA, GM, GH, GW, LR, LY, MU, NA, SC, SL, SZ, TG, ZM; Balkans/S.E. Europe: BA, LV, MD; Central Asia: TM, Europe: AD, AT, BE, BG, CZ, FO, GI, LI, LU, SM, SE; Latin America: AN, BS, CO, CU, DO, NI; Middle East: AE, BH, OM, QA, SA; South East Asia: KH, LA, PH, TH; South Asia: AF, BT, MV). • While ping blocking is still a big problem as many hosts start blocking over time, no countries were lost this year.
Normalized TCP Throughput Trends Seen from CERN 1998-2009 Little Improvement to Africa over the last eight years R. Cottrell
Plans for New Sub-SaharanUndersea Cables to Europe and India by 2011 • Ambitious plans are once again underway to better-connect the African continent, both East & West • Potential increase in capacity compared to now is 1000X: to the multi-Terabit/s range. • Is there is a sustainable market ? • Before the recession, outlook was at least one of these would succeed this time http://manypossibilities.net/african-undersea-cables
IEPM Measurements of Fiber Cuts in the MediterraneanDecember 2008(Also January 2008)From the ICFA SCIC 2009Monitoring Report
Three undersea cables cut: traffic greatly disturbed between Europe and Asia/Near East zone www.orange.com/en_EN/press/press_releases/att00006557/CP_cables_19dec08_EN.pdf France Telecom observed Dec. 19 that 3 major underwater cables were cut: “Sea Me We 4” at 7:28am, “Sea Me We3” at 7:33am and FLAG at 8:06am. Causes of the cut, located in the Mediterranean between Sicily and Tunisia, on sections linking Sicily to Egypt, remain unclear. Most traffic between Europe and Asia rerouted through the USA. Traffic from Europe to Near East & Asia interrupted to greater or lesser extent. First estimate of percentage of out-of-service capacity): Saudi Arabia: 55% out of service Djibouti: 71% out of service Egypt: 52% out of service UAE: 68% out of service India: 82% out of service Lebanon: 16% out of service Malaysia: 42% out of service Maldives: 100% out of service Pakistan: 51% out of service Qatar: 73% out of service Syria: 36% out of service Taiwan: 39% out of service Yemen: 38% out of service Zambia: 62% out of service
PingER Measurementsof the Impact of the Cuts on ThroughputVs. Time Cable Cuts on Dec. 19.Partial Recovery by Dec. 23 1 3 5 7 9 19 9 11 13 15 17 21 23 27 27