Download
1 / 41
410 likes | 660 Views
Comparison of Statistical Methods for Delay Measurement between Heart Sound Signals . פרוייקט סיום לתואר שני המחלקה להנדסה ביו-רפואית פברואר 2004 מציג: רן מוצ'ארי מנחה: פרופ' נתן אינטרטור. Outline. Arterial stiffness Heart & Carotid sounds Methods:

E N D
Comparison of Statistical Methodsfor Delay Measurement between Heart Sound Signals פרוייקט סיום לתואר שני המחלקה להנדסה ביו-רפואית פברואר 2004 מציג: רן מוצ'ארי מנחה: פרופ' נתן אינטרטור
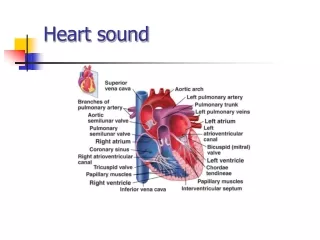
Outline • Arterial stiffness • Heart & Carotid sounds • Methods: • TF Estimation: Welch, Regression, Ridge Regression • Phase Delay • Cross Correlation with Predicted Signal • Results • Simulation, Healthy, Cardiac patients • Discussion & Conclusions
Arterial Stiffness - Control • Goal – distribute blood to active tissues by controlling smooth muscle constriction • Metabolic control – • Heart, brain, contracting skeleton muscles • Neural control (mostly sympathetic) - • Skin, resting skeletal muscles • Arterioles, muscular arteries, large arteries • Long term (tonic) and short term (phasic) • Other affecting factors (age, disease, BP)
Arterial Stiffness - Evaluation • Goal – prognostic and therapeutic information beyond blood pressure measurements • Direct methods – • Change of arterial dimensions in response to pressure change (US echo-tracking, MRI) • Indirect methods – • Pulse contour analysis (Pulse wave, Finger IR) • Pulse wave velocity (Tonometry, QKd, MRI, Doppler US) • Pulse wave velocity – • Pulse pressure wave – low frequency signal • Time-delay between two places • Foot-to-toot, peak-to-peak, cross correlation
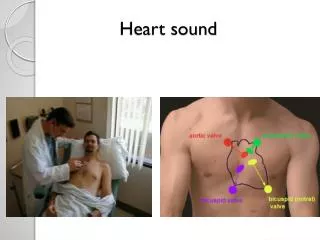
Onset of CaS1 coincides with onset of CP Onset of CaS2 coincides with CP dicrotic notch Carotid Artery Sounds (CAS) Taken from [Hasegawa,1991]
S1 caS1 S2 CaS2 Carotid Sounds – PCG and CAS
Methodology Welch, Regression or Ridge BPF phase slope TFE BPF TD filter Pred Env Peak CC Env Peak
TFE – General FIR Model v(n) x(n) h + y(n)
TFE Model - Welch • The periodogram: • Welch’s method for PSD estimation: • windowing and averaging • Welch’s transfer function estimator: • The Coherence function:
TFE Model – Regression and Ridge • Multiple regression model (y: Carotid Signal, X: Heart Sound) • Multiple regression solution: • Ridge regression solution:
Delay Estimation – Phase Data • Calculated between the S1/S2 complex at the heart and carotid • Time delay calculation – • method I: • Method II: Linear regression over phase data • Main difficulty – How to choose relevant frequencies for optimal Time Delay Estimation • Solution – frequency range of linear phase and high coherence values (30-90Hz, 30-120Hz)
30dB -15dB Method I Method II Simulation - Phase Data
Spurious prediction by Welch TF Simulation – Prediction (–15dB)
30dB 0dB -15dB Simulation - GCC Envelope
Original Signal S1 Removed from Heart Healthy Subject – Phase & Coherence
Breathing Noise – GCC Before BPF After BPF
Breathing Noise – Phase Before BPF After BPF
Breathing Noise – Carotid Prediction Aligned with caS2
Patient – Missing S1, Short S2 Delay Patient Recordings Were Provided by MediMon Inc.
Patient – GCC Welch Regress No TFE Ridge
Patient – Time Domain Filters Welch Regress Ridge
Discussion & Conclusions • Time-delay estimation of propagating heart pulse pressure wave is useful for monitoring short-term changes of arterial stiffness. • Heart and carotid sounds may be used instead of pressure wave, as demonstrated by Hasegawa. • GCC (Generalized Cross Correlation) of heart sound signal and predicted carotid signal according to Welch TFE (GCC) is sensitive to multiple delays, breathing noise, frequency filters etc. • Linear regression of Welch’s TFE phase requires frequency selection, and is not reliable when coherence is low (patient #1). • GCC with Ridge Regression TFE is the most stable method.
Future Directions • Check if propagation speed of heart sounds reflects arterial stiffness. • Validate results on larger population • Simulate of real events • Combine with pre-segmentation of S1 & S2 • Check adaptive methods • Synchronized averaging of Welch’s TFE
Time Domain Filter Envelope (0dB) Welch Regress Ridge
Time Domain Filter Envelope (–15dB) Welch Regress Ridge