Download
1 / 40
400 likes | 515 Views
What Caused It?. Rain . . . Rain . . . And MORE RAIN !!!. 12Z JUN 27 2006 500 Hpa. 12Z JUN 28 2006 500 HPA. 12Z JUN 28 2006 Surface Chart. 12Z JUN 28 2006 24-Hr PRECIP. STORM TOTAL PRECIP 72 HRS ENDING 062806 14Z. 8+. 6”. 5”.

E N D
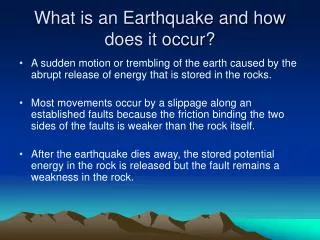
What Caused It? • Rain . . . • Rain . . . • And MORE RAIN !!!
Stream Channel Encroachment Is a BIG Problem !!!
How Did We Do It??? How Did We Do It ???
We Learned about the East Canada Creek
We started with a Unit Hydrograph from Northeast RFC for theEast Canada Creek at East Creek c f s HOURS 6 12 18 24 30 36 42 48 54 60 66 72
We modified it for a slightly smallerdrainage area and a lack of upstreamreservoirs A slightly smaller total volume A Sharper Peak due to lack of Reservoir Storage The October 1945 flood had some records on both gages.
Observations were, and continue to be a real problem! The gage at Dolgeville was either destroyed or demolished !!! There was a USGS gage at East Creek. But we had no means of getting real-time stages from it!!
We found a way to use data from the Power Company !!! Most hydro plants have measurements of… Pond and/or Tailwater Elevations Amount of power Generation Status of Gates and flashboards and if we’re lucky sometimes even Computed Flow in CFS !!!
Every Hydro Plant is Different !!! On the East Canada Creek, for example… Inghams can only “use” 750 cfs There are no waste gates. There is 4.5 ft of bladders. Beardslee can “use” 1500 cfs and let another 1500 cfs go thru by opening a waste gate. There can be 7 ft of boards.
The WHFS MPE was very helpful in determining how much rain fell over the area. Unadjusted radar can be misleading. This is especially true in mountainous terrain and at locations distant from the RDA site.
We had the NERFC run a Contingency Forecast on East Creek to give us an idea how much of a peak flow there would be. Forecast algorithms were developed many years ago. The East Canada did not become a regular forecast point due to the lack of observations and the complications caused by the hydroelectric plants.
We ran the WHFS Site Specific Forecast Model for Dolgeville using The MPE estimate along with some Additional forecast precip. It was still raining !!
We made a lot of use of FLARE prior to the deployment of the WHFS Site Specific Model. We also ran the approximate amount of Precipitation in FLARE to compare. FLARE is the FLood and River Emulator workstation p/c program that was developed by WFO/CRW in the 1990’s
We wrote and issued the Warning Using RiverPro We had only a limited amount of Specific impact data due to the Lack of details of the 1945 flood.
BULLETIN - IMMEDIATE BROADCAST REQUESTED FLOOD WARNING NATIONAL WEATHER SERVICE ALBANY NY 751 AM EDT WED JUN 28 2006 NYC035-043-057-282350- /X.NEW.KALY.FL.W.0035.060628T1150Z-060630T0258Z/ /DLGN6.3.ER.000000T0000Z.060628T1800Z.060629T2058Z.NR/ 751 AM EDT WED JUN 28 2006 THE NATIONAL WEATHER SERVICE IN ALBANY HAS ISSUED A * FLOOD WARNING FOR * THE EAST CANADA CREEK AT DOLGEVILLE WITH NEAR RECORD FLOOD.* UNTIL THURSDAY EVENING. * AT 7 AM ESTIMATED STAGE WAS NEAR 14 FEET. * FLOOD STAGE IS 10 FEET. * AT 15 FEET...SEVERE FLOODING AT DANIEL GREENE COMPLEX WITH HEAVY DAMAGE. * THIS CREST COMPARES TO A PREVIOUS CREST OF 15.1 FEET ON OCTOBER 2 1945. DO NOT DRIVE OVER FLOODED ROADS OR BRIDGES... STAY TUNED TO NOAA WEATHER RADIO...THE OFFICIAL VOICE OF THE NATIONAL WEATHER SERVICE...FOR LATER DEVELOPMENTS... FOR MORE DETAILS VISIT OUR WEB PAGE AT WWW.WEATHER.GOV. && FLD OBSERVED FORECAST 2 PM 8 PM 2 AM 8 AM 2 PM LOCATION STG STG DAY TIME WED WED THU THU THU EAST CANADA CREEK DOLGEVILLE 10.0 15.0 14.2 13.1 11.6 8.4 $$
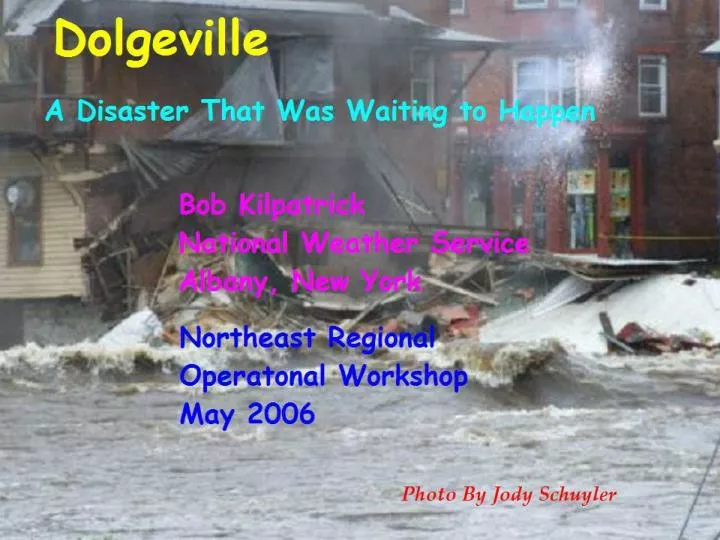
Did we get a good lead time??? NO! Only about an hour later the emergency manager reported water spilling over the Keyser Lake Dam. A little more than TWO HOURS later was when the Dolgeville Restaurant foundations failed and the building slid into the river!
Why Not ?? For one thing a lot was going on. Other Rivers were above Flood! They included the Mohawk River, Sacandaga River, Lake George, and the Esopus Creek.
Why Not ?? For one thing a lot was going on. Other Rivers were above Flood! We didn’t get real-time river stages which might have given us a clue to the magnitude of the developing flood!
Why Not ?? We Also Had Severe Weather!!!
How can we do better?? Get to Know Your Forecast Area. Utility Companies Co-op Observers SKYWARN spotters
How can we do better?? Get to Know Your Rivers USGS sites and studies Aerial and Satellite Images Google Maps www.terraserver-usa.com
How can we do better?? Radar and MPE products Time-Lapse OHP, THP
How can we do better?? Your WHFS Data Base Are ALL your USGS gages defined? Are there other sites you can use? WHFS Site Specific Model
How can we do better?? The QPF/QPS QPF vs POP grids Storms DON’T magically end at 12Z!! The QPS should reflect this!
How can we do better?? Workload Issues!!! Floods ARE Severe Wx! Geographic Sectors Anticipate—after all we ARE Forecasters!
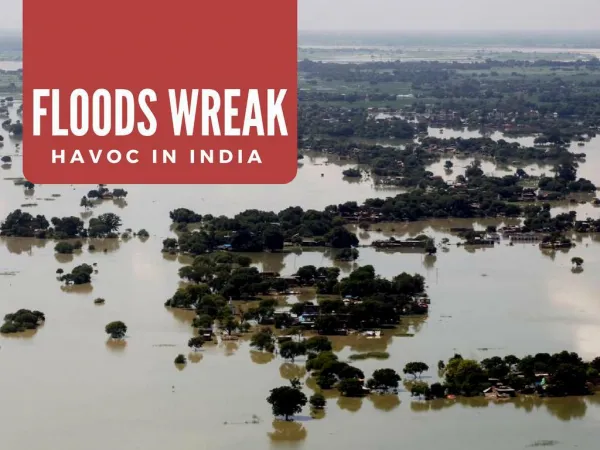
Damage Estimates • Estimated 20 Million in Damages • 650 Residents Filed for FEMA Assistance • 90% of municipalities filed Request for Public Assistance with FEMA • FEMA / SEMO will remain on-site until mid-October.
How this flood compared to others.. It was a NEW RECORD!!! About 36,500 cubic ft/second Other East Canada Creek Floods: 24000 in October 1945 17800 in January 1998 17000 in January 1996 15000 in May 2000 13900 in “The Great 1913 Flood”
Contributions from the following are gratefully acknowledged… John Quinlan and Steve DiRienzo – hydromet support WKTV Channel 2 Utica Robert Tracey and TEAM Legacy – Motivation and Inspiration Cathy Kilpatrick – PowerPoint Graphics help Ray O’Keefe – WCM WFO Albany Northeast River Forecast Center Warren Snyder – NROW