Download
1 / 41
430 likes | 683 Views
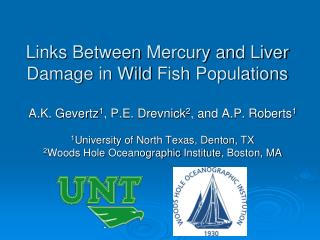
Gene Flow between Hatchery and Wild Fish. Don Campton U.S. Fish and Wildlife Service Abernathy Fish Technology Center Longview, WA. ?. Natural spawn. Hatchery spawn. ?. Problem: Fitness effects of gene flow. Fisheries 30(6): 11-23 (June, 2005). pNOB. 1.0 - pNOB. 1.0 - pHOS. pHOS.

E N D
Gene Flow between Hatchery and Wild Fish Don Campton U.S. Fish and Wildlife Service Abernathy Fish Technology Center Longview, WA
? Natural spawn Hatchery spawn ? Problem: Fitness effects of gene flow
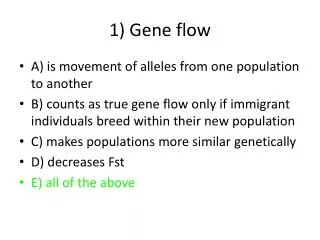
pNOB 1.0 - pNOB 1.0 - pHOS pHOS Natural spawn Hatchery spawn Gene Flow Proportions pNOB = proportion of hatchery broodstock composed of natural-origin adults pHOS = proportion of naturally-spawning fish composed of hatchery-origin adults
Fitness Optima in Two Environments Hatchery Optimum (θH) Natural Optimum (θW) Hatchery environment Natural environment Fitness Trait phenotypic values (e.g., spawn date)
Fitness Optima in Two Environments Hatchery Optimum (θH) Natural Optimum (θW) Hatchery environment Natural environment Fitness Z (pop. mean)
θH θW Hatchery environment Natural environment Fitness pNOB pHOS Zeq(equil. mean phenotype) Population Mean (Z) in Two Environments
Natural selection vs. phenotype (Ford 2002) θ= optimum phenotype;1/ω = intensity of selection θW – θH = intensity of domestication θH θW Hatchery environment Fitness Natural environment ωH ωW θW – θH -1.0 0.0 Trait phenotypic values (Z)
Equilibrium trait values: Balance between gene flow and natural selection qc = pNOB qw = pHOS After Ford (2002)
Natural Hatchery Hatchery Natural Broodstock Management:Genetic Integration vs. Segregation Integrated Segregated Goal: One population, Minimize genetic divergence Goal: Two populations, Allow genetic divergence Natural-origin fish in broodstock Hatchery fish only in broodstock One gene pool Two gene pools
Hatchery Natural Problem: Hatchery-to-wild gene flow Hatchery Natural Natural Spawning Segregated Genetic Risk Demographic Benefit? Integrated
Figure 1. Equilbrium mean values of a hypothetical trait among hatchery-origin fish ( zh(eq) ) as a function of the proportion of the broodstock (adult spawners) derived each year from natural-origin fish (pNOB): (a) θh= -1.0σ; (b) θh= -3.0σ. In these examples, no hatchery fish spawn naturally (pHOS = 0) and gene flow is strictly one-way from the natural environment to the hatchery environment. Three intensities of selection: strong selection (ωw = ωh = 2.0σ), moderate selection (ωw = ωh = 6.0σ), and weak selection (ωw = ωh = 10.0σ). When hatchery-origin fish are prevented from spawning naturally, only minor to moderate levels of one-way gene flow are necessary to prevent genetic divergence of a hatchery population due to domestication selection in the hatchery environment. Figure 2. Equilbrium mean values of a hypothetical trait ( z(eq) ) among hatchery and natural-origin fish as a function of the proportion of a hatchery broodstock (adult spawners) derived each year from natural-origin fish (pNOB): (a) θh= -1.0σ; (b) θh= -3.0σ. If pHOS = 0, then zw(eq) for natural-origin fish = θw = 0.0, and the equilibrium trait values (zh) are shown for hatchery-origin fish only. When hatchery-origin fish spawn naturally (pHOS > 0), substantially greater levels of gene flow from the natural environment to the hatchery environment are needed to reduce the genetic effects of domestication selection in the hatchery environment. The mean equilibrium trait values for hatchery and natural-origin fish are virtually identical in an integrated population with two-way gene flow. The mean trait value for the integrated population as a whole will be exactly halfway between the optimum values in the two environments (z(eq) = (θw + θc)/2 ) when pNOB = pHOS and the genetic effective number of breeders in the two environments are equal. When pNOB > pHOS, then the mean value of the population will be closer to the optimum value in the natural environment than the optimum in the hatchery environment. These examples assume moderate selection intensity (ωw = ωc = 6.0σ). pHOS = 0.0 pHOS = 0.0 Figure 1. Equilibrium trait value (Wild)Wild optimum (θW) = 0.0 Hatchery optimum (θH) = -1.0 Segregated hatchery: 1-way gene flow hatcherywild pNOB = 0.0 (no wild fish in broodstock) 5% (prop.hatchery fish in wild) Figure 2. pHOS = 0.1 ω = 6.0 (mod. sel.) Figure 4.
Equilibrium trait value (Hatchery)Wild optimum (θW) = 0.0 Hatchery optimum (θH) = -1.0 Integrated:1-way gene flow wild hatchery pHOS = 0 (hatchery fish do not spawn in wild) 10% (prop.wild fish in broodstock)
Equilibrium trait value (wild and hatchery)Wild optimum (θW) = 0.0 Hatchery optimum (θH) = -1.0 Integrated:2-way gene flow: wild hatchery pHOS=0.1 pHOS=0.3 (wild fish in broodstock)
Equilibrium trait value (wild and hatchery)Wild optimum (θW) = 0.0 Hatchery optimum (θH) = -1.0 Integrated:2-way gene flow: wild hatchery pHOS=0.1 pHOS=0.3 pNOB = pHOS (wild fish in broodstock)
Proportional Natural Influence (PNI)* (0 <PNI< 1.0) PNI = 1 ZW= wild optimum (goal) PNI = 0 ZW= hatchery optimum (high genetic risk) *from Craig Busack, Wash. Dept. Fish & Wildlife
Controlling gene flow to achieve goals PNI = pNOB / (pNOB + pHOS) = proportional natural influence = mean fitness of integrated population relative to natural population. = % time genes spend in natural environment.
HSRG guidelines for hatchery programs • Integrated broodstocks (pNOB > 0): • pNOB > 0.1 (at a minimum) • pNOB > pHOS (PNI > 0.5) • For biologically significant populations: • pNOB > 2 • pHOS (PNI > 0.67) • Segregated broodstocks (pNOB = 0): • pHOS < 0.05
All-H Analyzer (AHA) Spreadsheet Too • Ford’s (2002) Genetic fitness model • Beverton-Holt spawner-recruitment functions • Population dynamic effects of hatchery, harvest, hydropower, and habitat. Fitness Phenotypic value
All-H Analyzer (AHA) Spreadsheet Model (Habitat, Hydropower, Harvest, Hatchery) Combines Ford (2002) fitness model with Beverton-Holt spawner-recruit (R/S) model
AHA output: Predicted return of adult recruits Pink= Hatchery-origin adult recruits Green= Natural-origin adult recruits
AHA Model Example: Eagle Creek NFH coho salmon (Clackamas River, OR)
AHA Model Example: Eagle Creek NFH coho salmon Clackamas River, Oregon Option 4 Option 3 25% Habitat Increase Integrated Hatchery 200K smolts pNOB=30% pHOS=16% PNI=0.65 25% Habitat Increase Segregated. Hatchery 200K smolts pNOB=0 pHOS=33% Option 2 25% Habitat Increase No Hatchery Current Option 1 pNOB=0 pHOS=81% No Hatchery
“Supplementation”Desired Natural Spawning by Hatchery-Origin Fish(Two situations where pHOS > pNOB may be desired) • Basic question: Can the natural population sustain itself under current conditions? • YES, but abundance is substantially below desire levels. • Use supplementation temporarily (3 generations?) to increase natural population size (“jump-start”). • Assumes causes of decline have been rectified. • NO. Population is on an extinction trajectory. • Use hatchery as a “life support” system. • pHOS >> 0 provides a natural-spawning component of a hatchery-maintained population (pNOB > 0 in long-run).
Conclusion: Hatchery Management “We’ve come a long way, baby!”
Acknowledgements Hatchery Scientific Review Group (HSRG) U.S. Fish and Wildlife Service Hatchery Review Team • Lars Mobrand, Chair, HSRG (Developer of AHA) • Mike Ford, National Marine Fisheries Service (Fitness model) • Craig Busack, Washington Dept. of Fish and Wildlife (Sensitivity testing of model) USFWS Hatchery Review:www.fws.gov/Pacific/fisheries/hatcheryreview HSRG Hatchery Reform:www.hatcheryreform.us
Capacity = asymotote Productivity = slope at origin Beverton-Holt R/S curve
What is “Hatchery Reform”? Hatchery Reform is applying the same scientific principles to managing hatchery fish that we use for managing wild fish. • Maximize stock viabilities in the environments on which fish depend. • Conserve indigenous gene pools and support sustainable fisheries. • Predict and understand the biological consequences of • management decisions.
Beverton-Holt R/S curve Capacity = asymotote
Beverton-Holt R/S curve Productivity = slope at origin
Chronology for Pacific Salmon • 1872: 1st salmon hatchery, • McCloud River, California • 1877: 1st salmon hatchery on Columbia • River; Clackamas River, Oregon • 1900-1975: Development of hatchery • system in Wash., Oregon, Calif. • 1990-1999: ESA listings of Pacific salmon • 2000: Western Washington Hatchery Reform Project (HSRG formed) • 2005: Expansion of hatchery reform • initiative to Columbia River (USFWS)
Northwest Indian Fisheries Commission Western Washington Hatchery Reform Congressional Hatchery Science Advisory Team www.hatcheryreform.org
Hatchery Natural Segregated Hatchery Broodstocks • Creates hatchery-adapted population distinct from natural population. • Hatchery fish may pose genetic and ecological risks to natural populations. • Appropriate where: 1) Low probability of hatchery fish spawning naturally; 2) Spawning habitat no longer exists (e.g., mitigation for a dam); 3) Smolt release/adult recollection facilities are physically separated from natural spawning areas Segregated Two populations
Natural Hatchery • Artificially increases the demographic abundance of a natural population. • Requires a self-sustaining natural population to provide broodstock. • Appropriate for programs with conservation goals and where risks of natural spawning by hatchery fish need to be minimized. • Natural selection in wild drives mean fitness of hatchery origin fish. Integrated Hatchery Broodstocks Integrated One population
Gene flow vs. genetic drift (1-m)2 FST = —————————— 2Ne - (2Ne-1) (1-m)2 0 < FST< 1.0 Ne = effective population size m = migration (gene flow) proportion (Wright 1940)
Natural-origin proportion (M) of broodstock per generation to overcome random genetic drift
No. of natural-origin fish in broodstock per generation to overcome random genetic drift
Original report to Congress THE REFORM OF SALMON AND STEELHEAD HATCHERIES IN PUGET SOUND AND COASTAL WASHINGTON TO RECOVER NATURAL STOCKS WHILE PROVIDING FISHERIES Gorton Science Advisory Team May 7, 1999 GOALS: Goals of hatchery reform are to conserve indigenous genetic resources, assist with the recovery of naturally spawning populations, provide for sustainable fisheries, conduct scientific research, and improve the quality and cost-effectiveness of hatchery programs.
National Fish Hatcheries being reviewed Mid-Columbia Lower Columbia Lower Snake Warm Springs NFH