Download
1 / 1
10 likes | 157 Views
Summary. Materials and Methods (cont’d). Conclusions. Table 1. The 20 loci with the largest proportion of SNP variance explained using 3-SNP sliding windows.

E N D
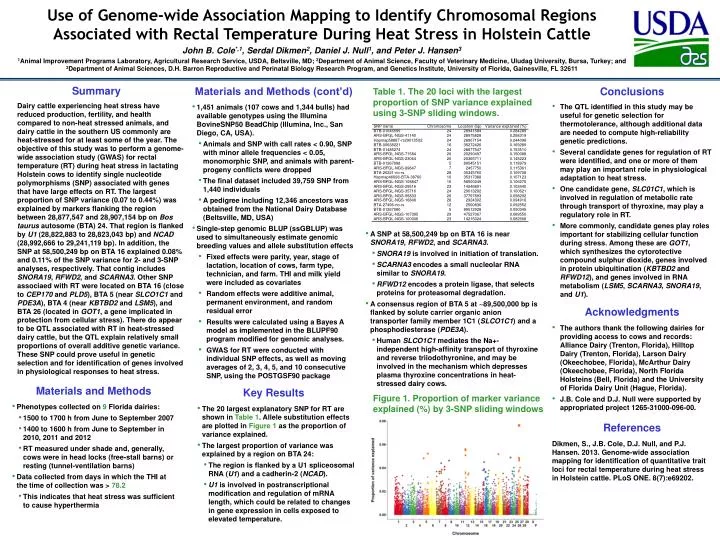
Summary Materials and Methods (cont’d) Conclusions Table 1. The 20 loci with the largest proportion of SNP variance explained using 3-SNP sliding windows. Dairy cattle experiencing heat stress have reduced production, fertility, and health compared to non-heat stressed animals, and dairy cattle in the southern US commonly are heat-stressed for at least some of the year. The objective of this study was to perform a genome-wide association study (GWAS) for rectal temperature (RT) during heat stress in lactating Holstein cows to identify single nucleotide polymorphisms (SNP) associated with genes that have large effects on RT. The largest proportion of SNP variance (0.07 to 0.44%) was explained by markers flanking the region between 28,877,547 and 28,907,154 bp on Bostaurus autosome (BTA) 24. That region is flanked by U1 (28,822,883 to 28,823,043 bp) and NCAD (28,992,666 to 29,241,119 bp). In addition, the SNP at 58,500,249 bp on BTA 16 explained 0.08% and 0.11% of the SNP variance for 2- and 3-SNP analyses, respectively. That contig includes SNORA19, RFWD2, and SCARNA3. Other SNP associaedwith RT were located on BTA 16 (close to CEP170 and PLD5), BTA 5 (near SLCO1C1 and PDE3A), BTA 4 (near KBTBD2 and LSM5), and BTA 26 (located in GOT1, a gene implicated in protection from cellular stress). There do appear to be QTL associated with RT in heat-stressed dairy cattle, but the QTL explain relatively small proportions of overall additive genetic variance. These SNP could prove useful in genetic selection and for identification of genes involved in physiological responses to heat stress. • The QTL identified in this study may be useful for genetic selection for thermotolerance, although additional data are needed to compute high-reliability genetic predictions. • Several candidate genes for regulation of RT were identified, and one or more of them may play an important role in physiological adaptation to heat stress. • One candidate gene, SLC01C1, which is involved in regulation of metabolic rate through transport of thyroxine, may play a regulatory role in RT. • More commonly, candidate genes play roles important for stabilizing cellular function during stress. Among these are GOT1, which synthesizes the cytorotective compound sulphur dioxide, genes involved in protein ubiquitination (KBTBD2 and RFWD12), and genes involved in RNA metabolism (LSM5, SCARNA3, SNORA19, and U1). • 1,451 animals (107 cows and 1,344 bulls) had available genotypes using the Illumina BovineSNP50 BeadChip (Illumina, Inc., San Diego, CA, USA). • Animals and SNP with call rates < 0.90, SNP with minor allele frequencies < 0.05, monomorphic SNP, and animals with parent-progeny conflicts were dropped • The final dataset included 39,759 SNP from 1,440 individuals • A pedigree including 12,346 ancestors was obtained from the National Dairy Database (Beltsville, MD, USA) • Single-step genomic BLUP (ssGBLUP) was used to simultaneously estimate genomic breeding values and allele substitution effects • Fixed effects were parity, year, stage of lactation, location of cows, farm type, technician, and farm. THI and milk yield were included as covariates • Random effects were additive animal, permanent environment, and random residual error • Results were calculated using a Bayes A model as implemented in the BLUPF90 program modified for genomic analyses. • GWAS for RT were conducted with individual SNP effects, as well as moving averages of 2, 3, 4, 5, and 10 consecutive SNP, using the POSTGSF90 package • A SNP at 58,500,249 bp on BTA 16 is near SNORA19, RFWD2, and SCARNA3. • SNORA19 is involved in initiation of translation. • SCARNA3 encodes a small nucleolarRNA similar to SNORA19. • RFWD12 encodes a protein ligase, that selects proteins for proteasomaldegradation. • A consensus region of BTA 5 at ~89,500,000 bpis flanked by solute carrier organic anion transporter family member 1C1 (SLCO1C1) and a phosphodiesterase (PDE3A). • Human SLCO1C1mediates the Na+-independent high-affinity transport of thyroxine and reverse triiodothyronine, and may be involved in the mechanism which depresses plasma thyroxine concentrations in heat-stressed dairy cows. Acknowledgments • The authors thank the following dairies for providing access to cows and records: Alliance Dairy (Trenton, Florida), Hilltop Dairy (Trenton, Florida), Larson Dairy (Okeechobee, Florida), McArthur Dairy (Okeechobee, Florida), North Florida Holsteins (Bell, Florida) and the University of Florida Dairy Unit (Hague, Florida). • J.B. Cole and D.J. Null were supported by appropriated project 1265-31000-096-00. Materials and Methods Key Results Figure 1. Proportion of marker variance explained (%) by 3-SNP sliding windows • Phenotypes collected on 9Florida dairies: • 1500 to 1700 h from June to September 2007 • 1400 to 1600 h from June to September in 2010, 2011 and 2012 • RT measured under shade and, generally, cows were in head locks (free-stall barns) or resting (tunnel-ventilation barns) • Data collected from days in which the THI at the time of collection was > 78.2 • This indicates that heat stress was sufficient to cause hyperthermia • The 20 largest explanatory SNP for RT are shown in Table 1. Allele substitution effects are plotted in Figure 1 as the proportion of variance explained. • The largest proportion of variance was explained by a region on BTA 24: • The region is flanked by a U1 spliceosomal RNA (U1) and a cadherin-2 (NCAD). • U1 is involved in postranscriptional modification and regulation of mRNA length, which could be related to changes in gene expression in cells exposed to elevated temperature. References • Dikmen, S., J.B. Cole, D.J. Null, and P.J. Hansen. 2013. Genome-wide association mapping for identification of quantitative trait loci for rectal temperature during heat stress in Holstein cattle. PLoS ONE. 8(7):e69202.