Download
1 / 7
70 likes | 183 Views
Price vs. Usage Variance Analysis August 2013 NAVY CEVM. Outline. Price vs. Usage Analysis Concept Price vs. Usage Analysis f ormulas for both labor and material Labor Price vs. Usage example Material Price vs. Usage example. Price vs Usage Concept.

E N D
Price vs. Usage Variance Analysis August 2013 NAVY CEVM
Outline • Price vs. Usage Analysis Concept • Price vs. Usage Analysis formulas for both labor and material • Labor Price vs. Usage example • Material Price vs. Usage example
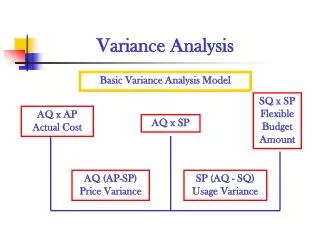
Price vs Usage Concept • For every variance, there is a price component and a usage component • Labor variances are driven by hours, labor rates, or both • Material variances are driven by units, unit cost, or both • For both labor and material, understanding the relative contribution of price versus usage helps to: • Validate the technical explanation in variance analysis reporting • Ensures that management attention and corrective action are properly focused
Price vs Usage Variance Formulas Labor Analysis: Material Analysis*: * Material price vs. usage analysis can be performed at the unit level for high value material or at a higher level for bundled low value material purchases
Labor Price Vs. Usage Example Scenario 1 – Correct hours estimate, but more expensive labor grade required Usage Variance = (100 hrs – 100 hrs) * $80/hr = $0 Price Variance = ($80/hr – $100/hr) * 100 hrs = ($2,000) Scenario 2 – Additional hours required, but performing labor grade correct Usage Variance = (100 hrs – 125 hrs) * $80/hr = ($2,000) Price Variance = ($80/hr – $80/hr) * 100 hrs = $0 Scenario 3– Additional hours required, more expensive labor grade required Usage Variance = (100 hrs – 110 hrs) * $80/hr = ($800) Price Variance = ($80/hr – $90.91/hr) * 110 hrs = ($1200)
Material Price Vs. Usage Example Scenario 1 – additional parts required due to damage, prices increased Usage Variance = (18 units – 20 units) * $2,000/unit = ($4,000) Price Variance = ($2,000/unit – $2,050/unit) * 20 units = ($1,000) Scenario 2– reduced part usage (less loss than anticipated), price dropped Usage Variance = (18 units – 17 units) * $2,000/unit = $2,000 Price Variance = ($2,000/unit - $1,960/unit) * 17 units = $680 Scenario 3– alternate vendor with a higher minimum buy, but lower unit cost Usage Variance = (18 units – 25 units) * $2,000/unit = ($14,000) Price Variance = ($2,000/unit - $1,400/unit) * 25 units = $15,000
Point of Contact Navy Center for Earned Value Management (703) 695-0510 http://acquisition.navy.mil/acquisition_one_source/cevm