Download
1 / 39
390 likes | 514 Views
Nuclear Power – An Energy Analysis. http://nuclearinfo.net. Martin Sevior Associate Professor School of Physics University of Melbourne. Energy and Entropy. 2 nd Law of Thermodynamics Entropy tends to increase Sharing of energy amongst all possible states

E N D
Nuclear Power – An Energy Analysis http://nuclearinfo.net Martin Sevior Associate Professor School of Physics University of Melbourne http://nuclearinfo.net
Energy and Entropy • 2nd Law of Thermodynamics • Entropy tends to increase • Sharing of energy amongst all possible states • Life is in a very low state of entropy • To exist it must create large amounts of entropy “away” from itself. • Life requires large amounts of Energy. http://nuclearinfo.net
Life and energy • Life takes energy from the sun http://nuclearinfo.net
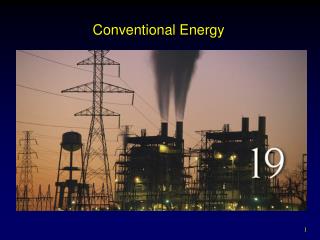
Energy and civilization • Our Civilization is based on cheap energy and machines • Previous civilizations utilized humans and animals. (Still the case for large parts of the world.) • Given sufficient quantities of energy our civilization can generate the products it needs. (Food, Metals, Plastics, Water) http://nuclearinfo.net
Energy in Australia • Australia’s Electricity needs are currently supplied by 44 GigaWatts of power stations. • This is forecast to grow by over 2% per year to around 60 GigaWatts by 2020 • On average 1.5 GigaWatts increase each year • Equivalent to Loy-Yang Power Station http://nuclearinfo.net
Energy in the World • China (pop 1.4 Billion) growing at 10% per year. • India (pop 1 Billion) growing at 6% per year. • Both aspire to Western standards of living • China likely to achieve current Australian standard in 2040’s • Effect will be to triple world energy consumption. • Only a large scale trade embargo will prevent them from effectively competing with the west. http://nuclearinfo.net
World Energy Growth. Energy Growth by “region” Energy Growth by source Projections are “business as usual” Source: U.S. Energy Information Administration. http://nuclearinfo.net
How long can we keep using Oil? • The rate of Oil usage is substantially greater than the rate of new Oil discoveries • Developing Nations have become competitors for Oil http://nuclearinfo.net
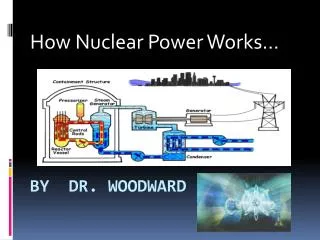
Global Climate Change • The Earth’s atmosphere acts as a “Greenhouse”. Traps heat that would otherwise be radiated to space. • Carbon Dioxide (CO2) is the 2nd largest contributor (and biggest driver) • Carbon Dioxide is also the fundamental byproduct of Fossil Fuel consumption • Large scale use of Fossil Fuels has substantially increased CO2 concentration http://nuclearinfo.net
CO2 increase in the Atmosphere http://nuclearinfo.net
Global Climate Change Predicted world temperature changes Past world temperature changes The different curves are different predictions based on different physical assumptions and future CO2 emissions The current CO2 concentration is unprecedented over half a million years http://nuclearinfo.net
Predictions for CO2 outputs The developing world will likely produce more CO2 emissions than the West before 2020 Only a large scale trade embargo on China and India and the rest of the developing world will prevent competition and growth http://nuclearinfo.net
The transition. • Having access to large amounts of cheap energy is vital for our civilization. • Over the next human generation we will need to manage a transition from our Fossil-Fuel based energy sources • The combination of resource depletion and Climate Change mitigation forces this. • Getting this right is vital for the world we leave our children. • I believe that this is one of the great issues facing my generation. http://nuclearinfo.net
Nuclear Power • Nuclear Power has been demonstrated to work at large scale. • France (80% Nuke, 20% Hydro) and Sweden (50% Nuke, 50% Hydro) have the lowest per capita greenhouse emissions of large countries in the OECD • Australia, with it’s reliance on Coal-powered electricity, has the highest http://nuclearinfo.net
Nuclear Energy • About 6 Billion years ago a supernova exploded in this region of space. • About 1 solar mass of hydrogen was converted to Helium in about 1 second • All the elements heavier than Lithium were created making life possible in the solar system • A tiny fraction of the energy was used to create heavy elements like Uranium and Thorium. http://nuclearinfo.net
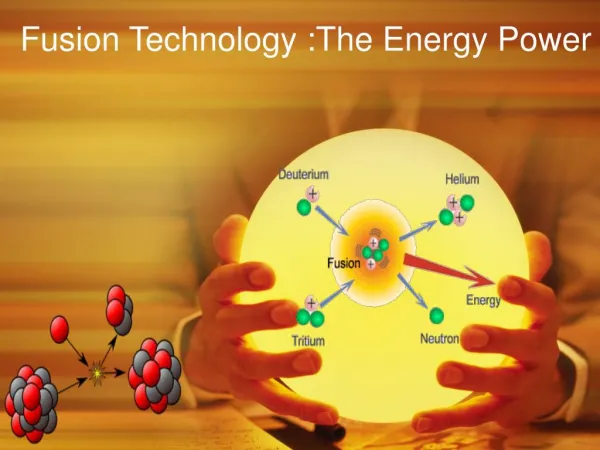
Nuclear Energy • Chemical reactions release a few electron-volts of energy per reaction. Nuclear Fission releases 240 Million electron volts per reaction A neutron is captured by 233U,235U or 239Pu. The nucleus breaks apart and releases 2-3 more neutrons. These in turn can induce further fissions. http://nuclearinfo.net
Nuclear energy • The energy release from a single fission reaction is about one-tenth that of an anti-matter annihilation. • There is as much energy in one gram of Uranium as 3 tonnes of coal. • The reaction produces no CO2 • So how much Uranium is present on Earth? http://nuclearinfo.net
Uranium Abundance. • The Earth’s crust is estimated to contain 40 trillion tonnes of Uranium and 3 times as much Thorium. • We have mined less than a ten millionth of this. (We have extracted about half of all conventional Oil) • If burnt in a “4th Generation” reactor provides 6 Billion years of energy. • If burned in a current reactor enough for 24 Million years. • But most is inaccessible. How much is really available? http://nuclearinfo.net
How long could Nuclear Power last? • How much energy does it take to build a Nuclear Power plant? • How much energy does it take to create Uranium fuel? • How much energy does a Nuclear Power plant produce over it’s lifetime? • This should be greater than the energy cost. http://nuclearinfo.net
The Nuclear Fuel cycle. http://nuclearinfo.net
Vattenfall • The Swedish Energy utility operates Nuclear, Hydro, Wind, BioMass, Solar and Fossil Fuel facilities. • Vattenfall have performed LifeCycle Analyses for these. • These are described in Environment Product Descriptions “EPD”. • Useful “Worlds Best Practice” reference http://nuclearinfo.net
Environmental Product Description The overall goals of an EPD is, "through communication of verifiable and accurate information, that is not misleading, on environmental aspects of products and services, to encourage the demand for and supply of those products and services that cause less stress on the environment, thereby stimulating the potential for market-driven continuous environmental improvement". Independently Audited http://nuclearinfo.net
Vattenfall’s EPD for Nuclear Power • Normalized for 1 GW Nuclear Power Plant. (NPP) operating for 40 years • Energy cost of Constructing the NPP • Energy cost of Mining and Milling U • Energy cost of enriching • Energy cost of dismantling the NPP • Energy cost of disposing the waste Units PetaJoules (PJ) = 1015 Joules. 1 GigaWatt year = 31.5 PJ http://nuclearinfo.net
System Boundaries In any Life Cycle Analysis there are boundaries. http://nuclearinfo.net
NPP Construction • Typical Construction tree. Total energy cost for Construction and Decommissioning NPP: 4 PJ http://nuclearinfo.net
Mining and Milling • Vattenfall utilize Uranium from Olympic Dam, Rossing and Navoi, Uzbekistan • Over 40-year life of NPP total energy cost of mining the Uranium. • 5.5 PJ http://nuclearinfo.net
Conversion and Enrichment • The “Yellow Cake” from the mines must be converted to UF6 , Neglecting U usage • 2 PJ • Then enriched to 3% 235U. Vattenfall uses a mixture of Gaseous Diffusion and Centrifuge • Neglecting U used for enrichment this becomes • 0.5 PJ http://nuclearinfo.net
Operations • Need to fabricate the Fuel rods 1.2 PJ • Energy used to operate the plant and consumed in ongoing Maintenance 1.1 PJ http://nuclearinfo.net
Waste Disposal • Sweden has a mature multibarrier waste disposal plan. Energy cost for 100,000 year isolation 4.3 PJ http://nuclearinfo.net
Total Energy Cost • Total Energy cost over 40 years (neglecting additional U) 18.6 PJ • Energy Generated (85% efficiency) 1054 PJ • Energy Gain of 56 • Repaid in 8 months of operation. http://nuclearinfo.net
CO2 emissions from Nuclear Vattenfall EPD calculations http://nuclearinfo.net
Vattenfall CO2 emissions from other sources http://nuclearinfo.net
Storm van Leeuwen and Smith • This website has been widely quoted • They find the Energy cost of building a NPP to be 82 PJ • Assume Decommission cost to be 82 PJ • Assume Waste disposal cost to be 82 PJ • Predict Mining and Milling cost to be Y = Yield C = % U3O8 or GigaJoules per Tonne http://nuclearinfo.net
Additional Assumptions • No new rich deposits of Uranium will be discovered. • An extrapolation of their formula implies no net energy gain at Ore concentrations of 0.02% and below.(Rossing works at 0.03%) • They conclude we will rapidly deplete the exploitable Uranium reserves with thermal reactors http://nuclearinfo.net
Testing Storm and Smith • How well do Storm and Smith reproduce currently operating Uranium mines? Ranger: Ore 0.25%: Predict 5.1 PJ/year, Report 0.8 PJ/year Olympic Dam: Ore 0.05% Predict 60 PJ/year, Report 5 PJ/year Rossing: Ore 0.035% Predict 69 PJ/year, Report 1 PJ/year These 3 mines provide 35% of current world production http://nuclearinfo.net
Cross Checks • 60 PJ is two Giga-Watt years of electricity • Cost of supplying this via Diesel is over 1 Billion dollars • At $40 Kg U Rossing only earns $100 Million per year • Entire energy consumption of Namibia is only 50 PJ http://nuclearinfo.net
Consequences… • Even with current mining technology we’re far from exhausting our recoverable Uranium. • We’ve mined less than 1 ten millionth of all the Uranium in the Earth’s crust. • Rossing provides 465 PJ of energy per year at an energy cost of 1 PJ • What can we estimate for the future? http://nuclearinfo.net
Uranium Abundance Current discovered, proven reserves amount to 3 Million tonnes, sufficient for 50 years at present consumption rates Rossing mine in Namibia has a Uranium abundance of 350 ppm and provides an energy gain of 500 Extrapolating to 10 ppm provides an energy gain of 14 4th Generation reactor (50 times more efficient Uranium usage) provides an energy gain of 100 at 2 ppm At least 8,000 times more Uranium can be usefully mined using current reactors. 32,000 times more with 4th Generation. (96 million years worth.) http://nuclearinfo.net
Nuclear Power is sustainable • The current Uranium price is nowhere near high enough to sustain the energy costs predicted by Storm and Smith • There will be no lack of Uranium for thousands of years. • The motivation for 4th generation reactors is really to reduce the amount of waste. http://nuclearinfo.net