Download
1 / 22
220 likes | 345 Views
Floodplain Management Session 11 Biology Water Quality Prepared by Susan Bolton, PhD, PE. Water Quality. Objectives:. Identify the major physical, chemical, and biology components used to characterize water quality Describe the importance of various water quality

E N D
Floodplain Management Session 11BiologyWater QualityPrepared by Susan Bolton, PhD, PE
Water Quality Objectives: • Identify the major physical, chemical, and biology • components used to characterize water quality • Describe the importance of various water quality • constituents to aquatic ecosystems • Learn how biological indicators are used to describe • water quality • Learn where to locate information on water quality for • your watershed and identify critical levels • Discuss stream and river ecology within the context • case study floodplains
Objective 11.1 Identify the major physical, chemical, and biological components used to characterize water quality
Commonly measuredsubstances related to water quality • Light • Temperature • Dissolved ions • Suspended solids • Nutrients and gases • Toxics such as metals and pesticides/herbicides
6000 Annual Degree Days 4000 2000 30 40 46 Latitude in degrees N Effect of latitude on stream degree days (Modified from Vannote and Sweeney 1980)
1.0 Midges Daily Growth Rate (mg/mg/day) 0.5 Blackflies Mayflies 0 0 8 16 24 32 Temperature C Influence of temperature on growth rates (Modified from Benke 1993)
Dissolved mineral concentrations in surface water Darker shades are higher concentrations: range from < 100 ppm to > 1800 ppm. Figure 3.16 in NRC 2000.
Dissolved mineral concentrations in ground water Darker shades are higher concentrations: range from < 1000 ppm to > 35,000 ppm
Average mg/l < 100 100-500 >500 Percent of Concentrations > 1000 mg/l < 20 20-50 > 50 Dissolved solids 1980-1989 Modified from Figure 40 in Smith, Alexander and Lanfear 1994.
Suspended sediment 1980-1989 Averagemg/l < 100 100-500 >500 Percent of Concentrations > 1000 mg/l < 20 20-50 > 50 Modified from Figure 43 in Smith, Alexander and Lanfear 1994.
pH range and the pH of common liquids http://www.epa.gov/volunteer/stream/vms54.html
Average Nitrate Concentrations 1980-1989 Averagemg/l < 1 1-3 >3 Percent of Concentrations > 1 mg/l < 20 . > 20 Modified from Smith, Alexander and Lanfear 1994
Averagemg/l < 0.1 0.1-0.5 > 0.5 Percent of Concentrations > 0.1 mg/l < 20 20-50 > 50 Total Phosphorus 1982-1989 Modified from Figure 42 in Smith, Alexander and Lanfear 1994.
14 12 Sea Level Dissolved Oxygen (mg/l) 10 1000 m 8 6 0 5 10 15 20 25 30 Water Temperature °C The effects of pressure and temperature on DO
Dissolved Oxygen Concentration (mg/l) Modified from Figure 38 in Smith, Alexander and Lanfear 1994.
Average colonies per 100 ml < 200 200-1000 >1000 Percent of Concentrations >200 colonies per 100 ml < 20 20-50 > 50 Fecal coliform bacteria 1980-1989 Modified from Figure 39 in Smith, Alexander and Lanfear 1994.
Herbicide concentrations in spring runoff, 1989 Largest square indicates values exceeding EPA drinking-water criteria Modified from Figure 50 in Smith, Alexander and Lanfear 1994.
Pollution in finfish tissues Modified from Figure 49 in Smith, Alexander and Lanfear 1994.
Concentrations of organic chemicals in finfish Modified from Figure 49 in Smith, Alexander and Lanfear 1994.
In class exercise • Work in teams and brainstorm the qualities or characteristics that would qualify a species as a good biological indicator of stream condition
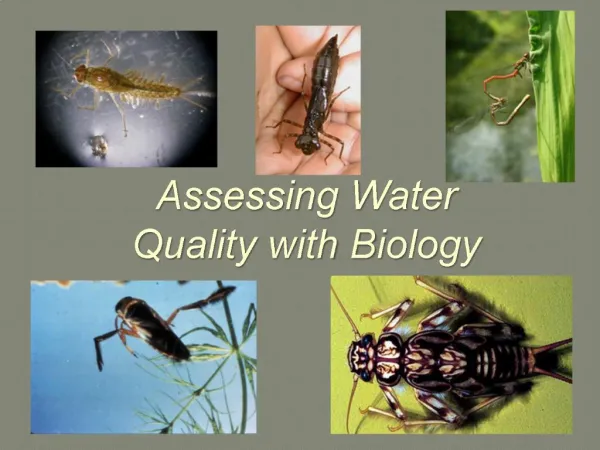
Muskellunge Large mouth bass Stonefly Caddis fly Riffle beetle Examples of organisms used as bioindicators Photos from www.epa.gov/bioindicators/html/photos_fish.html and www.epa.gov/bioindicators/html/photos_invertebrates.html
Objective 10.4 Identify critical levels (biological and regulatory) indicating water quality status for the various physical, chemical and biological constituents in stream water (Include the ability to explain why these constituents are important to floodplain management)