Download
1 / 35
350 likes | 498 Views
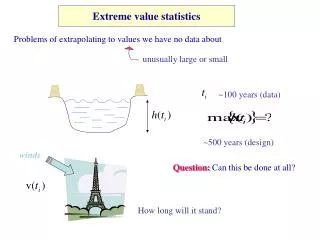
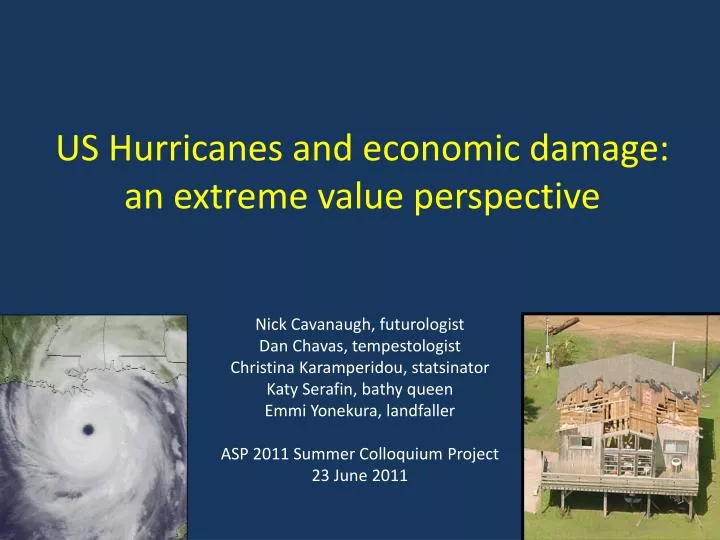
US Hurricanes and economic damage: an extreme value perspective. Nick Cavanaugh, futurologist Dan Chavas, tempestologist Christina Karamperidou , statsinator Katy Serafin , bathy queen Emmi Yonekura , landfaller ASP 2011 Summer Colloquium Project 23 June 2011. Outline. Motivation

E N D
US Hurricanes and economic damage: an extreme value perspective Nick Cavanaugh, futurologist Dan Chavas, tempestologist Christina Karamperidou, statsinator Katy Serafin, bathy queen EmmiYonekura, landfaller ASP 2011 Summer Colloquium Project 23 June 2011
Outline • Motivation • Previous work • Methodology and results • Economic data: absolute vs. relative damages • GPD without physical covariates • GPD with physical covariates • Application to GFDL current vs. future hurricanes • Conclusions and future work
Motivation: society Atlantic hurricane tracks (1900+) (NHC Best Track) GDP: 1o x 1o (Yale G-Econ) 63% of global insured natural disaster losses caused by US landfalling hurricanes (Source: Rick Murnane, last week) http://gecon.yale.edu http://gcaptain.com/wp-content/uploads/2010/09/Atlantic_hurricane_tracks.jpg
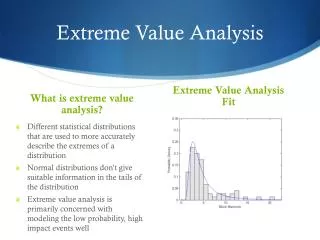
Motivation: science • Objectives: • Combine physical storm characteristics with statistics of damages in an extreme value theory framework • Reduce the sensitivity of statistical analysis of damage to economic vulnerability at landfall
Recent work • Katz (2002), Jagger et al (2008,2011) • Jaggeret al (2008,2011): Generalized Pareto Distribution (GPD) is appropriate for modeling extreme events involving large economic losses However, inclusion of physical characteristics of storms as covariates has not been tried
Methodology I: absolute vs. relative damage Economic data: Pielke et al., 2008 • Base year and normalized (2005$) economic damages for 198 storms (pre-threshold) from 1900-2004 But are variations in damages representative of the damage threat from a hurricane or rather of the large variation in economic value along the coast? Distribution of GDP (bil $) in 1o x 1o boxes along US coast
Methodology I: absolute vs. relative damage Physical characteristics of storms and economic value at landfall should be independent Neumayer et al. (2011) Physical Economic * corr = -.1 Damage Index (DI) Fraction of possible damage [0,1] i.e. “damage capacity” of storm Goal: remove from our damage database the variability in damages due to variations in economic value along the coast
Results Damages vs. DI: histograms Histogram of Total Damage: Histogram of Damage Index: Max = $150 bil Max = .89
Results Damages vs. DI: no covariates Damage Index (DI): [0,1] Total Damage: (bil 2005$) Bret .89 Great Miami $156 bil Top 10 by DI: Top 10 by Damage:
Results Damages vs. DI: no covariates Total Damage: (bil $) Damage Index (DI): [0,1] ξ > 0 ξ ~ 0
Results Damages vs. DI: no covariates Total Damage Damage Index (DI)
Methodology II: physical covariates Want to capture physical characteristics of individual storms that are relevant to its capacity to cause damage
Hurricane Katrina 8:15p CDT Aug 28 2005
Hurricane Katrina 8:15p CDT Aug 28 2005 Eye
Hurricane Katrina 8:15p CDT Aug 28 2005 Eyewall
Hurricane Katrina 8:15p CDT Aug 28 2005 R34
Methodology II: physical covariates Causes of damage Wind Storm surge • Sensitive to: • Wind speed (Vmax) • Size (R34) • Sensitive to: • Wind speed (Vmax) • Size (R34) • Bathymetry (seff) • Translation speed • Landfall angle See Irish et al. (2008) http://myfloridapa.com/type%20of%20claims.html
Methodology II: physical covariates • Wind speed Vmax: HURDAT Best Track 1900-2004 • Storm size R34: Extended Best Track (CSU) 1988-2005 • Bathymetry: gridded 1-min res altimetry data 100 km seff
Methodology II: physical covariates Bathymetry
Methodology III: GPD fit PDF With Multiple PossibleCovariates
ResultsDamage: with covariates Damages Damage = f(Vmax) *Using 1900-2004 data r34 : not enough data shape parameter left constant
Results DI: with covariates Damage Index Likelihood-ratio test DI = f(seff,Vmax) *Using 1900-2004 data r34 : not enough data shape parameter left constant
Methodology IV: Future Climate • Statistical-Deterministic Hurricane model (Emanuel et al. 2006) • downscaled from GFDL CM2.0 model: 1981-2000 and 2081-2100 (A1b) climates • Modeled values of Vmax and seff=> GPD
Results: Future Climate GPD PDF of US Hurricane Damage Index Add all PDFs and re-fit GPD for each climate
Results: Future Climate Local Distribution of Scale Parameter Change Δσlocal=Δ exp( σ0 + σ1Vmax + σ2seff)
Conclusions • Damage Index, which seeks to remove economic vulnerability from damages, appears to better capture role of physical characteristics of storm in causing damage than actual damages • Bathymetry, wind speed found to be useful covariates whose relationships are consistent with physical intuition • Changes in scale parameter in the future indicate a shift to higher probability of extreme damage events locally and globally, though we haven’t proven differences are statistically significant
Future work ideas • Find means of relating back to actual economic damages • Try rmax for size • Account for uncertainty • Try out a deterministic damage index and apply GPD to that? Thanks! Comments/suggestions welcome
Results Damages vs. damage index DI = f(seff)
Results Damages vs. damage index DI = f(Vmax)
Example 1: Katrina vs. Camille NOAA SLOSH model KATRINA (2005) CAMILLE (1969) Peak storm surge = 8.5 m Peak storm surge = 6.9 m …yet Katrina produced much higher storm surge because it was twice as large http://www.wunderground.com/hurricane/camille_katrina_surge.png http://www.nhc.noaa.gov/HAW2/english/surge/slosh.shtml