Download
1 / 15
150 likes | 416 Views
Drag coefficients Sean Bruinsma CNES Marcin Pilinski CU Boulder. The problem. The drag coefficient, C D , quantifies the atmospheric drag of an object. It depends on surface material, speed, temperature, atmospheric temperature and mean mass.

E N D
Drag coefficients Sean Bruinsma CNES MarcinPilinski CU Boulder
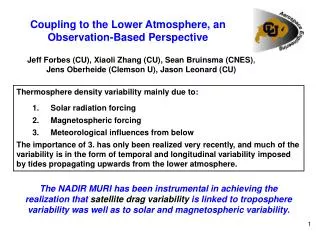
The problem The drag coefficient, CD, quantifies the atmospheric drag of an object. It depends on surface material, speed, temperature, atmospheric temperature and mean mass. The drag acceleration of a spacecraft is computed as follows: i.e., the drag coefficient scales density inferred from perturbation analysis or accelerometer data directly. But CD is not modelled according to standards…
GOCE: drag Simplest macro-model: Frontal area A = 0.70 m2 Mass = 1038 kg Optical properties: ‘GRACE’ Drag coefficient CD = 2.65 (Accommodated diffuse=2.01 Specular: 0.64) Using these values resulted in the densities to the right
GOCE: drag However, more realistic values appear to be: - A = 1.10 m2 - CD = 3.65 - Densities are 32% smaller when using the larger frontal area - Densities are 37% smaller when using the larger CD - Densities are 69% smaller when using larger frontal area and CD Difference with JB2008 increases!
GOCE: drag coefficient CD=3.5-3.6 Computed speed ratio: 9.0 – 10.3 NB: ESOC uses CD=3.7, and this gave good station acquisition results
Drag coefficient: high altitude We selected an easy object for the study: a sphere Satellite: Stella Launched: 26 September 1993 Mean altitude: 800 - 835 km Eccentricity: 0.02 Inclination: 98.6° Diameter: 24 cm Mass: 48 kg
Drag coefficient: high altitude Previous Work Harrison and Swinerd 1995: estimated CD based on multi-satellite analysis quasi-specular model CD=2.52 Pardini et al. 2006: Estimated basedon literature review, some adsorption considerations, and Cook’s modeldiffuse modelCD=2.2 - 2.8 [Pardini et al. 2006]
Drag coefficient: high altitude Diffuse Reflection With Incomplete Accommodation
Drag coefficient: high altitude Quasi-Specular Reflection and Goodman’s Model of Accommodation Adapted from Gregory and Peters 1987 • cosine reflection ν=2.215
Drag coefficient: high altitude Semi-Empirical Satellite Accommodation Model (SESAM) [Pilinski, 2011]
Drag coefficient: high altitude Model bias estimated by Bowman and Moe (2005)
Drag coefficient: high altitude Harrison and Swinerd, 1995
Drag coefficient: high altitude Pardini et al., 2006
Drag coefficient: high altitude Conclusions Due to the large uncertainty in model inputs (i.e. accommodation coefficient), lack of surface reflection data, and the significant differences in model results (±15%), one could state that the problem of physical drag coefficients at 800 km remains largely unsolved Fitted ballistic coefficients corrected for model bias result in a CD between 2.3 to 2.7 SESAM predicts a CD between 2.8 and 3.0 Accommodation values of 0.9 or higher will probably result in incorrect CD at altitudes around 800 km. Therefore a value of 2.2 is likely to be too low.