Download
1 / 9
90 likes | 94 Views
Theory, Results and Implementation. Implications for Patient Safety August 19 th , 2008. Francois de Brantes National Coordinator. About PROMETHEUS Payment. Not for profit with independent BOD made up of employers, plans, providers, health care services experts

E N D
Theory, Results and Implementation Implications for Patient Safety August 19th, 2008 Francois de Brantes National Coordinator
About PROMETHEUS Payment • Not for profit with independent BOD made up of employers, plans, providers, health care services experts • Funded in 2006 by CMWF to develop and model Evidence-informed Case Rates • Funded in 2007 by RWJF to develop implementation plan • Funded in 2008 by RWJF to support pilot implementations
Core Concepts of Prometheus • The price of an episode of medical care is specific to any patient-provider-payer triad • The price has to include all the services recommended by evidence or expert opinion • Episodes can be priced for chronic care, procedural care, or acute care • There is no need for legal or financial integration of providers, just clinical integration • The current rate of “defects” has to be cut by half
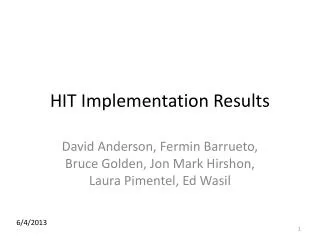
Risk bifurcation in the PROMETHEUS model Global Cap Total Cost of Care “Coarse” Episodes Reliable Care Costs of all Diabetes Episodes Costs of all Typical Episodes Costs of all Potentially Avoidable Complications Costs of all Base Services Costs of all Severity Adjusters ECRs Insurer – Probability risk Provider – Technical risk Consumer – Probability risk
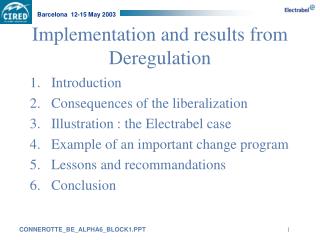
An Evidence-informed Case Rate… for each patient-provider-payer combination Total ECR price = Type of services * Frequency * Price per service Based on 50% of current defect rate Allowance for Potentially Avoidable Complications Margin Currently based at 10% Severity-adjustment caused by known patient health status Arrived at through step-wise multi-variable regression model Adjusts ECR for local patterns “Normal” variation reflecting practice patterns Informed by guidelines and empirical data analysis Core services that are recommended by best practice or evidence The ECR explicitly removes excess cost of care caused by errors and creates a strong incentive to eliminate defects and improve quality.
PACs, HACs, and Never Events • Potentially Avoidable Complications also include Never Events and Hospital-Acquired Conditions • Our most recent data suggest that HACs represent 30% of the PACs in hip or knee replacements • A PAC is essentially anything that harms the patient • We’re not looking for zero defects, we’re looking to halve the current rate of defects and create a powerful incentive to go beyond that • Industrial process re-engineering suggests that getting beyond Six Sigma often requires an expense that exceeds any known benefit • The stricter the rule, the more likely games will be played
Results of AMI Model – Patient A $61,500 $61,500 Scorecard Incentive
Results of Diabetes Model – Patient B $6,500 $6,500 Scorecard Incentive
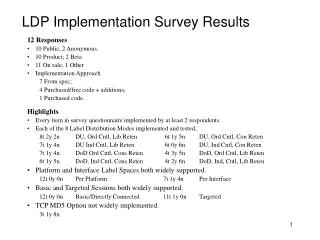
Total margin relative to Potentially Avoidable Complication Rate