Download
1 / 1
10 likes | 118 Views
INTRODUCTION Recent years have seen substantial interest in shortening dry period length Considerable research has been done to determine effects on cow performance

E N D
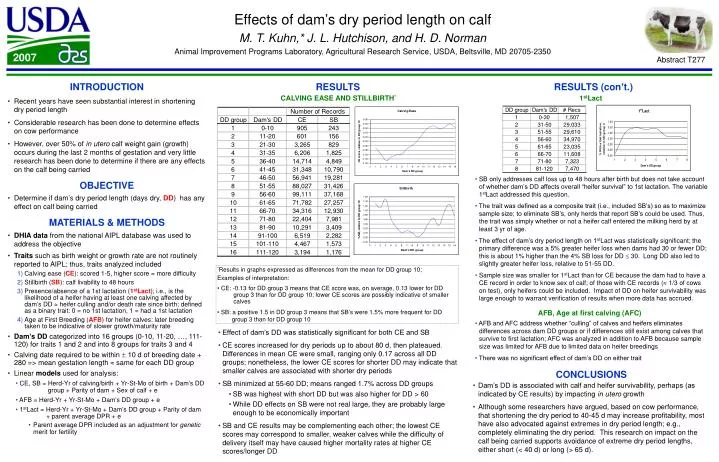
INTRODUCTION • Recent years have seen substantial interest in shortening dry period length • Considerable research has been done to determine effects on cow performance • However, over 50% of in utero calf weight gain (growth) occurs during the last 2 months of gestation and very little research has been done to determine if there are any effects on the calf being carried • OBJECTIVE • Determine if dam’s dry period length (days dry, DD) has any effect on calf being carried • MATERIALS & METHODS • DHIA data from the national AIPL database was used to address the objective • Traits such as birth weight or growth rate are not routinely reported to AIPL; thus, traits analyzed included • Calving ease (CE): scored 1-5, higher score = more difficulty • Stillbirth (SB): calf livability to 48 hours • Presence/absence of a 1st lactation (1stLact); i.e., is the likelihood of a heifer having at least one calving affected by dam’s DD heifer culling and/or death rate since birth; defined as a binary trait: 0 = no 1st lactation, 1 = had a 1st lactation • Age at First Breeding (AFB) for heifer calves: later breeding taken to be indicative of slower growth/maturity rate • Dam’s DD categorized into 16 groups (0-10, 11-20, …, 111-120) for traits 1 and 2 and into 8 groups for traits 3 and 4 • Calving date required to be within 10 d of breeding date + 280 => mean gestation length same for each DD group • Linear models used for analysis: • CE, SB = Herd-Yr of calving/birth + Yr-St-Mo of birth + Dam’s DD group + Parity of dam + Sex of calf + e • AFB = Herd-Yr + Yr-St-Mo + Dam’s DD group + e • 1stLact = Herd-Yr + Yr-St-Mo + Dam’s DD group + Parity of dam + parent average DPR + e • Parent average DPR included as an adjustment for genetic merit for fertility RESULTS RESULTS (con’t.) CALVING EASE AND STILLBIRTH* 1stLact • SB only addresses calf loss up to 48 hours after birth but does not take account of whether dam’s DD affects overall “heifer survival” to 1st lactation. The variable 1stLact addressed this question. • The trait was defined as a composite trait (i.e., included SB’s) so as to maximize sample size; to eliminate SB’s, only herds that report SB’s could be used. Thus, the trait was simply whether or not a heifer calf entered the milking herd by at least 3 yr of age. • The effect of dam’s dry period length on 1stLact was statistically significant; the primary difference was a 5% greater heifer loss when dams had 30 or fewer DD; this is about 1% higher than the 4% SB loss for DD 30. Long DD also led to slightly greater heifer loss, relative to 51-55 DD. • Sample size was smaller for 1stLact than for CE because the dam had to have a CE record in order to know sex of calf; of those with CE records ( 1/3 of cows on test), only heifers could be included. Impact of DD on heifer survivability was large enough to warrant verification of results when more data has accrued. • *Results in graphs expressed as differences from the mean for DD group 10; • Examples of interpretation: • CE: -0.13 for DD group 3 means that CE score was, on average, 0.13 lower for DD group 3 than for DD group 10; lower CE scores are possibly indicative of smaller calves • SB: a positive 1.5 in DD group 3 means that SB’s were 1.5% more frequent for DD group 3 than for DD group 10 AFB, Age at first calving (AFC) • AFB and AFC address whether “culling” of calves and heifers eliminates differences across dam DD groups or if differences still exist among calves that survive to first lactation; AFC was analyzed in addition to AFB because sample size was limited for AFB due to limited data on heifer breedings • There was no significant effect of dam’s DD on either trait • Effect of dam’s DD was statistically significant for both CE and SB • CE scores increased for dry periods up to about 80 d, then plateaued. Differences in mean CE were small, ranging only 0.17 across all DD groups; nonetheless, the lower CE scores for shorter DD may indicate that smaller calves are associated with shorter dry periods • SB minimized at 55-60 DD; means ranged 1.7% across DD groups • SB was highest with short DD but was also higher for DD > 60 • While DD effects on SB were not real large, they are probably large enough to be economically important • SB and CE results may be complementing each other; the lowest CE scores may correspond to smaller, weaker calves while the difficulty of delivery itself may have caused higher mortality rates at higher CE scores/longer DD • CONCLUSIONS • Dam’s DD is associated with calf and heifer survivability, perhaps (as indicated by CE results) by impacting in utero growth • Although some researchers have argued, based on cow performance, that shortening the dry period to 40-45 d may increase profitability, most have also advocated against extremes in dry period length; e.g., completely eliminating the dry period. This research on impact on the calf being carried supports avoidance of extreme dry period lengths, either short (< 40 d) or long (> 65 d).