Download
1 / 2
20 likes | 148 Views
CNMS Staff Science Highlight. Real -Time Optical Diagnostics of Rapid Graphene Growth. Scientific Achievement.

E N D
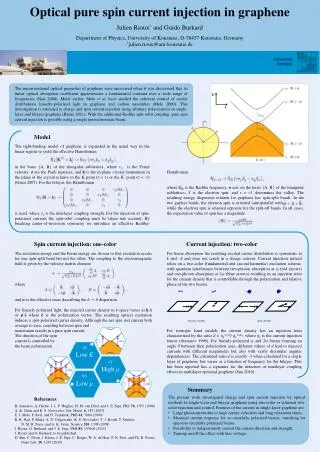
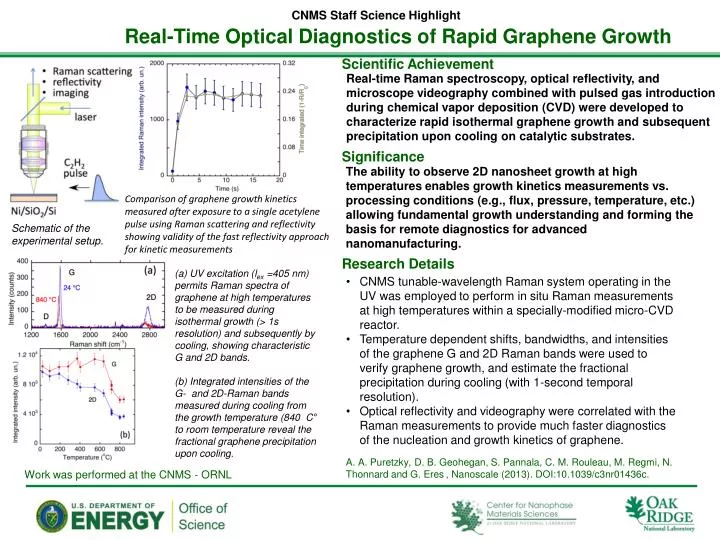
CNMS Staff Science Highlight Real-Time Optical Diagnostics of Rapid Graphene Growth Scientific Achievement Real-time Raman spectroscopy, optical reflectivity, and microscope videographycombined with pulsed gas introduction during chemical vapor deposition (CVD) were developed to characterize rapid isothermal graphene growth and subsequent precipitation upon cooling on catalytic substrates. Significance • The ability to observe 2D nanosheet growth at high temperatures enables growth kinetics measurements vs. processing conditions (e.g., flux, pressure, temperature, etc.) allowing fundamental growth understanding and forming the basis for remote diagnostics for advanced nanomanufacturing. Comparison of graphene growth kinetics measured after exposure to a single acetylene pulse using Raman scattering and reflectivity showing validity of the fast reflectivity approach for kinetic measurements Schematic of the experimental setup. Research Details (a) UV excitation (lex =405 nm) permits Raman spectra of graphene at high temperatures to be measured during isothermal growth (> 1s resolution) and subsequently by cooling, showing characteristic G and 2D bands. (b) Integrated intensities of the G- and 2D-Raman bands measured during cooling from the growth temperature (840 C° to room temperature reveal the fractional graphene precipitation upon cooling. • CNMS tunable-wavelength Raman system operating in the UV was employed to perform in situ Raman measurements at high temperatures within a specially-modified micro-CVD reactor. • Temperature dependent shifts, bandwidths, and intensities of the graphene G and 2D Raman bands were used to verify graphene growth, and estimate the fractional precipitation during cooling (with 1-second temporal resolution). • Optical reflectivity and videography were correlated with the Raman measurements to provide much faster diagnostics of the nucleation and growth kinetics of graphene. A. A. Puretzky, D. B. Geohegan, S. Pannala, C. M. Rouleau, M. Regmi, N. Thonnard and G. Eres, Nanoscale (2013). DOI:10.1039/c3nr01436c. Work was performed at the CNMS - ORNL
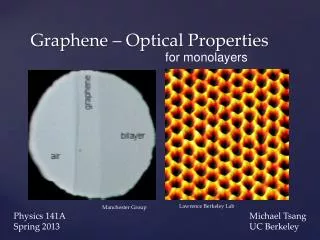
CNMS Staff Science Highlight Watching Graphene Grow Scientific Achievement Optical microscopy and laser light scattering were developed at the Center for Nanophase Materials Sciences to directly watch graphene grow on catalytic substrates at high temperatures. Significance • Graphene – a single layer of graphite just one atom thick – has special properties that make it ideal for applications such as flexible electronics and electrodes for energy storage. Direct methods to observe graphene growth processes are essential to optimize its properties and provide online diagnostics for its nanomanufacturing. Characteristic vibrational lines in the Raman spectra of graphene (marked as D, G, and 2D ) allowed the monitoring of its growth at high temperatures. Schematic of the experimental setup. Research Details • Video movies through a microscope, along with reflected and Raman scattered light, were combined with pulsed gas introduction to characterize the time evolution of graphene growth. Selected frames from a movie at the indicated times (in seconds) taken through a microscope show how graphene patches (shaded red) nucleate after a delay and then rapidly grow after a pulse of acetylene gas on a thin Ni film at 800°C. A. A. Puretzky, D. B. Geohegan, S. Pannala, C. M. Rouleau, M. Regmi, N. Thonnard and G. Eres, Nanoscale (2013). DOI:10.1039/c3nr01436c. Work was performed at the CNMS - ORNL