Download
1 / 18
180 likes | 264 Views
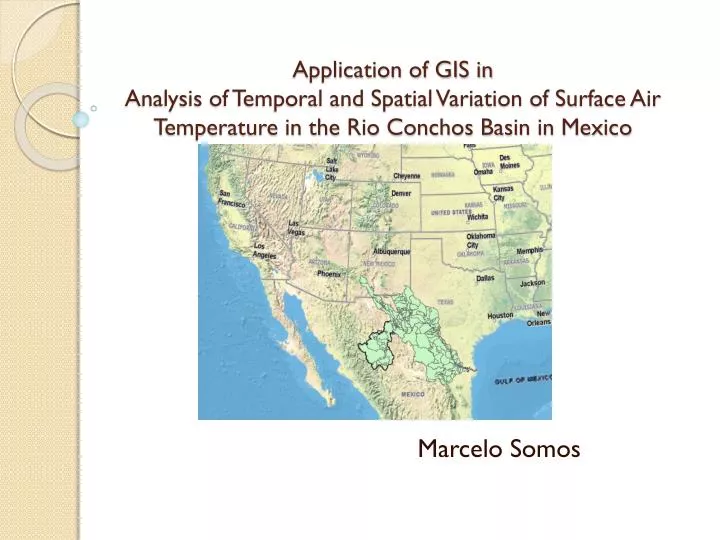
Application of GIS in Analysis of Temporal and Spatial Variation of Surface Air Temperature in the Rio Conchos Basin in Mexico. Marcelo Somos. Introduction.

E N D
Application of GIS in Analysis of Temporal and Spatial Variation of Surface Air Temperature in the Rio Conchos Basin in Mexico Marcelo Somos
Introduction • The warming of the climate system has become a reality by taking into account the observations of increases in global average air and ocean temperatures, widespread melting of snow and ice, and rising global mean sea level, etc. • This phenomenon is affecting the temporal and spatial distribution of the temperature.
Global Warming http://www.nytimes.com/gwire/2009/11/11/11greenwire-new-army-corps-policy-forces-project-designers-7288.html
Many processes are affected by the temperature • Biological processes • Glacial melting • Flora and Fauna development • Water quality (Dissolved oxygen) • Etc.
Water Quality Example http://ga.water.usgs.gov/edu/dissolvedoxygen.html
Objectives • Extract the monthly values of temperature estimated by a GCM in the Conchos River Basin during three different periods (2010 to 2019, 2020 to 2029 and finally 2040 to 2049)
Objectives • Use the tool model builder in order to automate the process of extraction of data from the NetCDF file • Analyze the behavior of the surface air temperature for the next 40 years in the Conchos Basin
Study Area • This project is focused on the Conchos river. It has a drainage area of 67,862 km2. • Geographically, it is located within the coordinates 26° 03’ and 30° latitude north, and 104° to 107° West
Main Source of Data: IPCC Typically having a horizontal resolution of between 250 and 600 km
Santa Clara University Horizontal resolution of 15 by 15 km
Scenarios SRES A2: (~"higher" emissions path) Technological change and economic growth more fragmented, slower, higher population growth (In this project the Hadley United Kingdom is used) http://gdo-dcp.ucllnl.org/downscaled_cmip3_projections/dcpInterface.html#About
Methodology 5 processes per month in 12x30=360 months. That means 1800 processes.
Model builder Now 30 Processes
Temporal Variation • The temperature will increase between November and June • The temperature will decrease between July and October.
Spatial Variation Variation of temperature between November 2010 and November 2049 November 2010