Download

1 / 71
710 likes | 843 Views
Lecture Demonstrations and the Force Concept Inventory. Brian Andersson Physics Education Seminar 3/25/05. Motivation. I was curious to see how demos impact student learning. Is there any reason to believe demos have an impact on FCI scores? Is there enough data to say one way or the other?.

E N D
Lecture Demonstrations and the Force Concept Inventory Brian Andersson Physics Education Seminar 3/25/05
Motivation • I was curious to see how demos impact student learning. • Is there any reason to believe demos have an impact on FCI scores? • Is there enough data to say one way or the other?
Overview • To determine if there is any correlation between Phys 1301 FCI results and demo usage • Start with the large picture • Work down to individual questions
Previous Work • Sokoloff and Thornton have been working on Interactive Lecture Demonstrations (ILD) • Gains on the Force and Motion Conceptual Evaluation are reported to be significantly higher for students taking lectures involving ILDs American Journal of Physics65:1, 14 (1997)
Differences • ILDs require an entire class period to perform. • Very few demonstrations are actually used. • I am looking at standard lecture demonstrations (0-10 demos per lecture, duration 1-5 minutes) • Presentation of demos vary from one instructor to the next
Analysis - First Pass • I looked at the total number of demonstrations used in a semester versus two results from the FCI • Average Post Test % • Average Relative Gain • Analysis covers 1301 classes from Fall Semester 1999 to the present (33 sections)
Initial Impressions • Very messy. No correlation. • Try limiting analysis to instructors who have taught 1301 at least 4 times since fall 1999. • There are three: Profs X, Y, and Z.
Second Pass • Again, very little correlation. • Previous analysis includes demos not relevant to FCI (rotational dynamics, SHM, etc...) • Second analysis involves matching existing demonstrations (FCI demos) to specific FCI questions. • Once matches are made, compare usage to Post Test % and RG
FCI Demo List QuestionsDemo(s) 1 1C20.10, .15, .16 3 1C20.15, 1D60.05 4 1H10.13 6 1D55.10, .11 7 1D50.15 8, 9, 10, 11 1N20.40 12 1D60.60, .65 13 1D60.05 14 1D60.10 17 1G20.60 18 1D50.37, .38 25, 26, 27 1K20.10, .15, .20, .30 28 1H10.10, .12
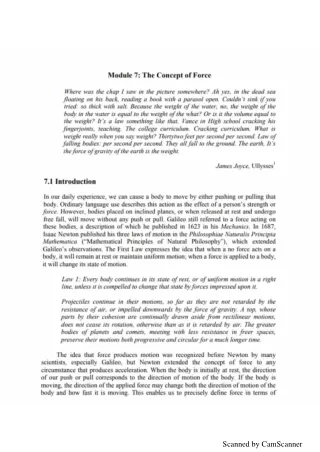
Examples of FCI Demos • Question 1 involves two balls identical in appearance but differing in mass by a factor of 2 • Existing demo involves plastic and steel balls
FCI Demos • Some demos do not match to questions exactly, but convey the idea • An example is question 28
Third Pass • The previous plots show little, if any, correlation between FCI demos and the FCI over a wide range. • The next step was to focus my analysis on the three instructors who have taught 1301 at least 4 times since 1999 • I assumed that their teaching style changed little over the years. • It was hoped that changes in demo usage might be reflected in FCI scores.
Fourth Pass • Still no convincing data. • The next step was to analyze individual instructors and terms. • Looked at the Post Test % and RG for each question. • Would using FCI demos increase these scores compared to questions not associated with a demo?