Download
1 / 47
470 likes | 557 Views
This paper discusses a research activity support system for cooperative research across universities and industries, utilizing the Internet for multimedia data transmission and database storage. The system includes components like "NetSemi" for network conferences and "PDB" for private database management. It also covers quality of service considerations for Internet-based activities and experiments measuring QoS metrics. The text language is English.

E N D
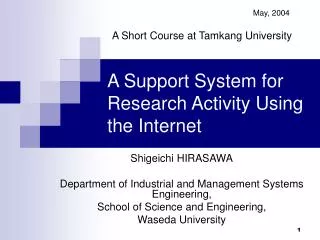
May, 2004 A Short Course at Tamkang University A Support System for Research Activity Using the Internet Shigeichi HIRASAWA Department of Industrial and Management Systems Engineering, School of Science and Engineering, Waseda University
1. Introduction • Objectives Research Activity Support System over Universities and Industries for cooperative research work For : Technical Meeting, Seminars, Forums, Conferences, Symposiums, Lectures, Private Research Guide and Technical Advice, … • Transmission of multimedia data (voice, text, video and image) via Internet • Database system for papers, documents, books, figures, tables and experimental data.
Using Internet Educational activity support systems …distance learning system Research activity support systems …ARPANET Support System for Research Activity “NetSemi” System Configuration (1) Network conference system “NetCon” …Electronic conference (2) Private database system and its information retrieval system “PDB”
(K)Haunyan Univ. Lee Waseda Univ. Hirasawa Lab. Matsushima Lab. 2. Configuration of Support System NetSemi (GB) Cambridge Univ. Sakai (USA) UCLA W.W.Chu Internet (USA) U.Hawaii Matsushima Osaka Electron & Comm. Univ. Kohnosu Aizu Univ. Nakazawa Waseda Univ. Remote terminal of NetCon Bizmate Server PDB Fig2.1 The support system for research activity NetSemi
Network Conference System NetCon Projector Video Camera White Board Tablet Headset Speaker Internet Video Storage HD Microphone Gateway HUB Terminal (PC) 2.1 Network Conference System NetCon Fig2.2 The network conference system NetCon
2.2 Private database system and its information retrieval system PDB Gateway HUB Private database system and its information retrieval system PDB WWW Server VR Search Engine CBS Search Engine (to be introduced) OCR Multimedia DB Fig2.3Private database system and its information retrieval system PDB
Inverted file Computer Query User Secondary Information Boolean formula Boolean operation Formatting Retrieved results Reference No. list Preprocessing Reference file Primary information Reference List (Title/Abstract/Contents) • Information Retrieval System (Visual Recall) Fig2.4Direct Retrieval System (Visual Recall)
Computer User Secondary Information Psudo document Vector Space model Similarity Computation Query Classification Engine Similarity ranking list Preprocessing Reference file Retrieved results Primary Information Ranking list (Contents) • Information Retrieval System (Concept base search) Fig2.5Concept based retrieval system (Concept base search)
Characteristics of Concept Base Search • Retrieval System by Natural Language (Pseudo document) • Concept based Similarity Ranking • Automatic Generation of Related Index • Multi-document format acceptable • Multi-storaging platform acceptable
Vectorization of document Numberising an importance between terms vectorizing of document by importances between terms Importance of 4WD Outdoor 0.5 4WD 0.7 ・・・ Document Doc B Doc A Importance of leisure drive 0.7 family 0.5 ・・・ Doc C Query Query searching document similar to query by using vector Fig2.6Vectorization of document
3. Quality of Service for Internet • Internet : no assurance of the quality of channel make clear the conditions that NetCon can be satisfactorily held • packet loss • packet delay • jitter • through put
1 10 100 1000 [ms] 1 10-3 Voice Video Image Character Diagram 10-6 10-9 delay time [ms] loss rate [%] Fig 3.1 QoS for ATM communication network
delay time on other voice communications delay time on other communications
Protocol Layer 7 (Application layer)MPEGMultimedia document communication protocol JPEG ODA Layer 4 (Transport layer)TCP Layer 3 (Network layer)IP End-to-end communication …for data transmission Layer 1 (Physical layer)ATM (IPo ATM) performance for software process to movie and voice (VoIP) →to hardware
Internet Table 3.3 Multimedia communications
3.1 Delay Time End-to-End delay time transmitter receiver • (3)codec (coding time) • (2)time to make packets • (2)buffer time with jitter • (3)codec(decoding time) • (1) network delay time Fig 3.2 Delay time construction
packet loss rate With intolerable With patient With satisfactory packet delay
4. Experiments 4.1 Measurements of QoS (1) Experiment for real communication links we evaluate the QoS for real communication links. delay time and packet loss rate are measured for links
Experimental data of QoS Waseda Univ. (Japan) – Cambridge Univ.(GB) Packet Delay [ms] Packet Loss [%] Time [Hour] Fig. 4.1 QoS for Waseda Univ. – Cambridge Univ.(1)
Experimental data of QoS Waseda Univ. (Japan) – Cambridge Univ. (GB) Fig. 4.1 QoS for Waseda Univ. – Cambridge Univ. (2)
Experimental data of QoS Waseda Univ. (Japan) – Cambridge Univ.(GB) Fig. 4.1 QoS for Waseda Univ. – Cambridge Univ.(3)
Experimental data of QoS Table 4.1 Waseda Univ. (Japan) – Cambridge Univ.(GB) Actual path
Experimental data of QoS Waseda Univ. – Univ. of Hawaii packet delay (ms) time [hour] Fig. 4.2 QoS for Waseda Univ. – Univ. of Hawaii
Experimental data of QoS Waseda Univ. – UCLA packet delay (ms) time [hour] Fig. 4.3 QoS for Waseda Univ. – UCLA.
Experimental data of QoS : network delay time and packet loss rate 1)Waseda Univ. (Japan) –Cambridge Univ.(GB) 2)Waseda Univ. (Japan) – UCLA (USA) 3)Waseda Univ. (Japan) – University of Hawaii (USA) 4)Local area network in Waseda Univ. Table 4.1 Typical values of network delay time tn and packet loss rate pt
(2) Experiments for CPU and OS : packet and buffer delay time connection without Hub, Router NetCon(1) NetCon(2) To measure the delay time to packet by measuring End-to-End delay time ideal channel • Performance of NetCon (1) • CPU : Pentium4 (1.2GHz) • OS : Windows XP Performance of NetCon (2) Fig. 4.4 Experimental Conditions
Delay time with different CPU (Case3) Fig. 4.5 Average packet and buffer delay time for different CPU’s(1)
Delay time with different CPU (Case3) Fig. 4.5 Average packet and buffer delay time for different CPU’s(2)
Delay time for different OS (Case1) Fig. 4.6 Average packet and buffer delay time for different OS’s(1)
Delay time for different OS (Case2) Fig. 4.6 Average packet and buffer delay time for different OS’s(2)
Through put with different OS (Case2) Fig. 4.6 Average packet and buffer delay time for different OS’s(3)
Conclusion of Experiment : packet and buffer delay time • delay time with different OS • Windows98 > Windows2000 • settings of MTU or RWIN • Windows XP > Windows2000 • stability more than processing speed • similar results by benchmark tests with applications • delay time with different CPU • Cerelon(400MHz) > Pentium3(1GHz) = Pentium4(2GHz) • From the result on through put : it is important to prepare terminals with adequate OS and CPU
(3) codec ideal delay Table 4.2 Recommendation of CODEC delay time • ideal delay • delay with waiting for input sequence • delay with analysis of input voice • delay with filter processing
4.2 Evaluations of NetCon by simulated communication link • preparing a test system by Internet Simulator • evaluation by a questionnaire
Experimental System Microsoft Netmeeting Matsushima Lab. Hirasawa Lab. Remote terminal of NetCon Remote terminal of NetCon Network Simulator Measurement= Packet Delay, Packet Loss Evaluation= a questionnaire survey Repeatability …an effect of learning Psychological factor・・・ a prejudice Fig. 4.7 Method and conditions for experiment
Evaluation method • parameters of QoS • packet delay time 0 , 300, 500, 1000 (ms) • packet loss rate 0, 5, 8, 10 (%) • terms of questionnaire • 「with sufficiently - with patient - with intolerable」 5 1 • evaluating by voide, video and total • examinee:12 people (students in Hirasawa and Matsushima Lab. ) • setting of MS NetMeeting • size of video transmission : Large, quality : High Fig. 4.8 Evaluation method
Degree of Satisfaction for Netcon Table 4.3 Degree of satisfaction for NetCon Evaluation by Voice Evaluation by Video Total Evaluation
Degree of Satisfaction for Netcon Table 4.4 Degree of satisfaction for NetCon • discussion is highly depending on voice • delay on changing slides in discussion is the question • Each speaks simultaneously, confusion has occurred by delay. • Each speaker should pay attention with that.
5. Discussion 5.1 Real communication links • Experimental data for the delay time and the packet loss rate mainly in network show that: • There are many bad hours in the QoS to use NetCon dependent on the business hours of each country. These hours should be avoided to hold the electronic conference. • The QoS varies with time dependent on paths of the link and jobs processed in routers on the path [Takano01]. • The network delay time t_n is not necessarily dependent on its actual distance. It may depend on the constructed path of the link (source to destination). • The other experimental data for the delay time in the PC show that: • With respect to CPU’s, the performance of Celeron (400MHz) is inferior than that of Pentium III (1GHz) whose performance is almost the same as Pentium IV (2GHz). • With respect to the OS’s, the performance of Windows 2000 is better than that of Windows 98 or Windows XP. This fact has been known by benchmark test using application programs [IT03].
5.2 Evaluation by simulated link • Table 4.3 shows that: • There is the region in the delay time and the packet loss rate where the students are satisfied with NetCon. • There is a trade-off between the delay time and the packet loss rate in the region. • Table 4.4 shows that if the students adapt themselves to use NetCon, then the tolerable region becomes large. The reasons are that: • Discussions are made mainly by voice (conversation) not by images. • Q&A requires a small delay time. If they carefully start Q&A by their experience, a larger delay time will be tolerable.
6. Concluding Remarks • We have clarified by the experiment of the simulated link that there are the conditions for which NetCon can be satisfactorily used, and by that of the real communication link in the Internet that we can attain these conditions by carefully and properly choosing the hours in a day and the days in a week, even if we want to develop NetCon to all over the world. • To do so, we must gather data of the QoS before beginning to hold the electronic conference. • It is also shown that choosing CPU and the OS for the terminals are important to keep the QoS. • It should be noted that experiences and trainings for users in practical use of NetCon will help to enlarge the regions of the conditions for the QoS. • Although detailed experiments and discussions will be necessary to make clear the conditions for the QoS of the communication link (the Internet) whether NetCon can be satisfactorily used, we can roughly conclude the region of these conditions as shown in Fig. 6.1.
Required conditions for QoS of Internet for NetCon packet loss rate (%) 10 8 ● ● 5 with satisfactory GB – Japan ● ● 0 0 300 500 packet delay (ms) Fig 6.1 Required conditions for QoS of Internet for NetCon
100 • sufficiency mean opinion test worse average bad 50 good better 0 0 1 1.5 2 2.5 3 4 5 MOS(mean opinion score) Fig. MOS(mean opinion score)