Download
1 / 12
120 likes | 206 Views
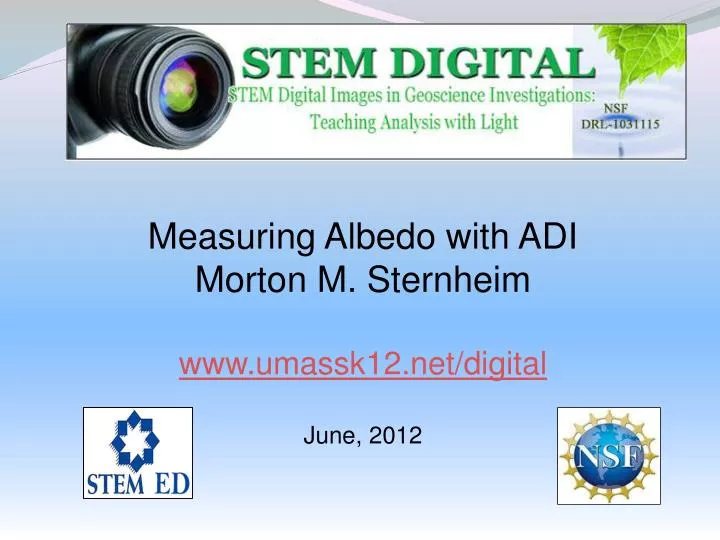
Measuring Albedo with ADI Morton M. Sternheim www.umassk12.net/digital June, 2012. Objectives. ADI Learn how to use Rectangle Tool to measure intensity (brightness) Learn how to use Line Tool Learn how to use File Graph Colors Learn how to avoid over exposing photos Content

E N D
Measuring Albedo with ADI Morton M. Sternheim www.umassk12.net/digital June, 2012
Objectives ADI Learn how to use Rectangle Tool to measure intensity (brightness) Learn how to use Line Tool Learn how to use File Graph Colors Learn how to avoid over exposing photos Content Understand role of albedo in Polar climate change Understand how albedo depends on surface
Big Idea • Why are Polar Regions more affected by global warming than other parts of the globe? • One reason (there are others) is that as sea ice melts and more open water appears, more energy is absorbed, and warming accelerates. • This is a form of positive feedback and it makes the polar climate change faster than the climate in temperate areas. • Increasing vegetation on land also has a similar positive feedback effect.
Albedo • This effect is a change in the albedo – the fraction of the incident sunlight that is reflected back to space. • The albedo is much higher for snow and ice than for water or vegetation. http://www.energyeducation.tx.gov/environment/section_3/topics/predicting_change/img/albedo.gif
Measuring Albedo with ADI • Use Xerox paper as a standard; use 0.6 as its albedo • Avoid overexposure by having the paper fill • about half the image Xerox paper on grass
Draw a Xerox Rectangle Average color 77.61
Draw a Sample Rectangle Average color 10.86
Result • Albedo = 0.6 x (sample value)/(Xerox value) • In this example, • Albedo of grass area = 0.6 (10.86/77.61) = 0.084 = 8.4% • .
File Graph Colors Same Result ~75% ~10% Colors turned off
Comments This is a simple activity and does not depend on an understand of color basics, pixels, etc. Caution: If any intensity is 100% or close to that, the photo is overexposed and cannot be used to measure the albedo.