Download

1 / 40
400 likes | 467 Views
Epidemiology Applications. Fran C. Wheeler, Ph.D School of Public Health University of South Carolina Columbia, SC 29208 (803) 777-5054 Fran.wheeler@sc.edu.

E N D
Epidemiology Applications Fran C. Wheeler, Ph.D School of Public Health University of South Carolina Columbia, SC 29208 (803) 777-5054 Fran.wheeler@sc.edu
Developed as part of an Enhanced AHEC Community Partnership for Health Professions Workforce and Educational Reform project funded by the Health Resource and Service Administration (HRSA)
OBJECTIVES • applications of epidemiologic method
Assessing Risk and Burden of Disease • Relative Risk • Odds Ratio • Attributable Risk
Relative Risk • Calculated to identify differences in disease rates between exposed and unexposed groups. • Risk of disease among exposed risk of disease among unexposed • RR = 1, no difference • RR > 1, association between exposure and disease
Odds Ratio • Calculated to identify likelihood of exposure to a risk when comparing two groups, one with and one without disease. • Exposure odds in disease group exposure odds in non-disease group • Ratio = 1, no association • Ratio > 1, association between exposure and disease
Attributable Risk • Calculated to identify the proportion of disease among exposed people that actually results from the exposure • Individual attributable risk = RR - 1 / RR • Population attributable risk = Pe (RR - 1) / 1 + Pe (RR - 1), where Pe = proportion of population exposed
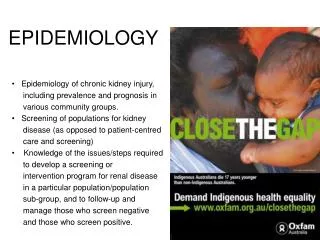
Epidemiology in Action • Outbreak and Cluster Investigations • Public Health Surveillance • Community Screening Programs
Outbreaks and Clusters • Outbreak: an epidemic limited to a localized increase in the incidence of a disease • Cluster: an aggregation of relatively uncommon events or diseases in space and/or time in amounts believed or perceived to be greater than expected by chance
Characteristics of Outbreak Investigations • Infectious disease or condition • Etiologic agent is transmissible organism • Short time frame for investigation (hours, days) • Moderate to large effect estimates • Moderate to high exposure levels
Characteristics of Outbreak Investigations, cont. • Acute exposure period (hours, days) • Laboratory confirmation common • Moderate to high possibility of establishing cause and effect • Most common study design: retrospective cohort
Characteristics of Cluster Investigations • Non-infectious disease or condition • Often unknown or combined etiologic agents • Longer time frame for investigation (weeks or months) • Weak to moderate effect estimates • Low exposure levels
Characteristics of Cluster Investigations, cont. • Chronic exposure period (years or decades) • Laboratory confirmation uncommon • Low possibility of establishing cause and effect • Most common study design: case-control
Challenges of Cluster Investigations • Active or passive approach • Epidemiology or public health education • Data sources and denominators • Costs and yields
Public Health Surveillance • Ongoing systematic collection, analysis and interpretation of outcome-specific health data • Closely integrated with the timely dissemination of those data to those responsible for preventing and controlling disease or injury
Sources of Surveillance Data • Reports of health events • Reporting from laboratories • Registries • Vital statistics • Periodic surveys • Information on environmental exposures • Information from other organizations
Uses of Surveillance Information • Immediate detection • Annual dissemination • Archival information
Community Screening Programs • Defining the target population • Setting priorities among diseases and conditions • Choosing effective screening tests • Assessing the effectiveness of screening programs
Sample Data • AIDS • Syphilis • Diabetes
Estimated Incidence of AIDS and Deaths of Adults with AIDS*, 1985 - June 1998, United States 25,000 1993 definition AIDS s implementation h Deaths t 20,000 a e D / s e s 15,000 a C f o r 10,000 e b m u N 5,000 0 1988 1989 1987 1998 1986 1996 1995 1985 1994 1997 1993 1990 1991 1992 Quarter-Year of Diagnosis/Death *Adjusted for reporting delays
AIDS Cases by Age and Sex Reported 1981-1998, United States 35,000 30,000 Male N=574,783 25,000 Female N=113,414 20,000 Number of Cases 15,000 10,000 5,000 0 90 80 0 30 40 50 10 20 60 70 Age at Diagnosis 3
Estimated Number of Persons Living with AIDS 1993 -1998, by Sex, United States 250 200 Men 150 Thousands 100 Women 50 0 1993 1994 1995 1997 1998 1996 Year
Estimated Number of Persons Living with AIDS 1993 - 1998, by Race/Ethnicity, United States 140 120 White, not Hispanic 100 Black, not Hispanic 80 Thousands 60 Hispanic 40 American Indian/ 20 Alaska Native Asian/Pacific Islander 0 1993 1994 1995 1996 1997 1998 Year
Estimated Number of Persons Living with AIDS 1993 - 1998, by Race/Ethnicity, United States 2,500 2,000 Asian/Pacific Islander Persons 1,500 American Indian/ Alaska Native 1,000 500 0 1993 1994 1995 1996 1997 1998 Year
Estimated Number of Persons Living with AIDS 1993 -1998, by Region, United States 120 100 80 South Northeast Thousands 60 40 West Midwest 20 U.S. dependencies and possessions 0 1993 1994 1995 1996 1997 1998 Year
Proportion of AIDS Cases, by Race/Ethnicity Year of Report,1985-1998, United States 70 White, not Hispanic 60 50 Black, not Hispanic 40 Percent of Cases 30 Hispanic 20 American Indian/ Asian/Pacific Islander 10 Alaska Native 0 1985 1987 1989 1991 1993 1995 1997 Year of Report
AIDS Cases by Exposure Category and Year of Report, 1985-1998, United States 80 70 Men who have sex with men (MSM) 60 50 40 Percent of Cases Injection drug use (IDU) 30 Heterosexual contact 20 MSM & IDU 10 0 1985 1987 1989 1991 1993 1995 1997 Year of Report Excludes cases with other or unreported risk pending medical record review and reclassification.
AIDS Rates per 100,000 Population Reported in1998 7.8 VT 3.4 3.3 2.5 0.9 6.2 4.0 NH 3.5 2.6 3.9 2.0 15.0 47.9 MA 1.2 7.3 12.9 RI 2.6 CT 20.3 14.5 4.3 14.8 6.1 NJ 26.3 8.2 6.6 10.8 23.4 DE 7.9 4.7 17.3 4.8 MD 31.9 14.7 8.1 7.1 DC 189.1 10.4 12.8 8.5 13.8 12.0 20.3 8.0 16.9 15.1 11.1 20.1 Rate per 100,000 36.5 21.8 <5 4.7 5 - 14.9 15+ 13.5 PR 44.3 VI 29.6
AIDS Cases Reported in 1998 and Estimated 1998 Population, by Race/Ethnicity, United States AIDS Cases Population N=48,269* N=274,766,000 71% 33% <1% 1% 1% 45% 4% 20% 13% 12% White, not Hispanic Asian/Pacific Islander Black, not Hispanic American Indian/ Alaska Native Hispanic *Includes 211 persons with unknown race/ethnicity
AIDS in Adult/Adolescent Men by Race/Ethnicity per 100,000 Population, Reported in 1998 United States Rate Cases Race/Ethnicity White, not Hispanic 14,027 18 Black, not Hispanic 14,740 125 Hispanic 7,511 58 Asian/Pacific Islander 329 9 American Indian/ 117 16 Alaska Native 36,886 34 Total* * Includes 162 men whose race/ethnicity is unknown.
AIDS by Region & Size of Place of Residence Reported in 1998, United States Non- Metropolitan Metropolitan metropolitan area 500,000 area 50,000- area population 499,999 population % % % Northeast 93.1 4.5 2.4 N=14,399 North Central 76.3 14.4 9.3 N=4,317 South 75.6 13.5 10.9 N=19,474 West 86.7 8.2 5.0 N=8,121