Download
1 / 21
210 likes | 225 Views
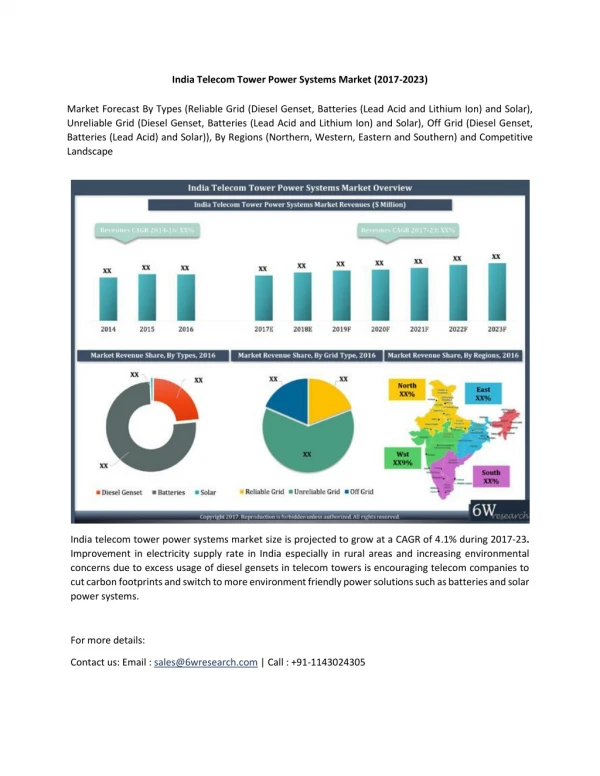
India Telecom Market. Telecom Circle http://www.telecomcircle.com. Background. Indian mobile industry is the fastest growing across the world adding 15-20 million new subscribers every month 2 nd largest market after China in terms of number of subscribers

E N D
India Telecom Market Telecom Circle http://www.telecomcircle.com
Background • Indian mobile industry is the fastest growing across the world adding 15-20 million new subscribers every month • 2nd largest market after China in terms of number of subscribers • Crossed 500 million mobile subscriber mark in Dec, 2009 • Fixed line subscription at 35 million which is shrinking every month. The rest of the presentation would focus on mobile industry as it is the most significant part of Telecom Industry
Structure of Indian Mobile Industry • India is divided into 23 circles and separate licenses have been issued for each circle • Division of circles mostly along the state boundaries • Circles were categorized as Metros, A, B and C based on the revenue potential of the circle when 1st set of auctions were held in 1995
Brief History of Indian Mobile Industry 1994 Start of Cellular operations 2004 Calling Party Pays (CPP) Introduced 2000-01 3rd/4th Operator Licenses 2008 Fresh Licenses issued to 6 players 1999 New Telecom Policy 2003 CDMA networks launched 2005 Lifetime Validity Products Issued 2009 Tariff wars amongst operators
Mobile Subscriber Growth responded to policy and competitive changes In million Source: COAI, AUSPI
Fixed Line subscriber base is Shrinking The fixed line subscriber base is stagnant at 37 million for last two years
Handset Market Size • Gartner and other analysts estimated Indian Handset market size f0r 2009 between 1115-125 million • Low cost handsets dominate with the average selling price of $60-65 • Nokia has the dominant market share followed Samsung and LG • Share of CDMA in handsets is on a decline after the decision of Reliance and Tata to focus on GSM
Competitive Intensity • As a result of separate licenses, there are few pan India operators. However, in the period 1999-2005, consolidation led to emergence of larger players • In 2007-08, new licenses were issued to new players taking total number of operators in each circle to as high as 13
Current Operators GSM CDMA • BhartiAirtel • Vodafone • Idea • BSNL/MTNL • Aircel • Reliance • Tata • Uninor • Stel • BPL • Reliance • Tata Indicom • MTS
Tariff wars (2009 onwards) • India is currently the most competitive market in the world which has led to tariff wars $1 = Rs 45 Rs 1 = 100 p
Impact of Tariff wars • Revenue growth has got impacted significantly • The break-even point for new operators has increased significantly • Increase in churn and Multiple SIM • It is estimated that only 50% of new subscriber addition is actually new subscribers. Rest all are either churning from one network to another or are adding to Multiple SIM phenomena
High Proportion of Prepaid Subscribers 99% of new subscriber additions are in prepaid
High volumes have led to continuous decline in costs in line with the ARPU GSM ARPU & Cost data (Rs)
Composition of GSM operator revenues Revenue Break-up as % of Gross Revenues Gross Interconnect Usage Revenue 15% Other Revenues 2% VAS Revenues 10% 1% Outroaming Surcharge 56% Airtime (including roaming Airtime) 10% Activation & Processing Fees 5% 2% Rentals Outroaming Airtime Net Service Revenue = 78% of Gross Service Revenue Net Service Revenue = Gross Service Revenue – Interconnection Usage Costs – Outroaming Airtime Source: PwC Benchmarking report - 2008
v Composition of GSM operator costs Network operating expenses proportion of costs increased from 36% in 2005 to 51% in 2008 Source: PwC Benchmarking report - 2008
r VAS Revenues are dominated by SMS and Ring-back Tones
Regulatory Issues • Defense occupies chunk of spectrum and hence there is scarcity of spectrum leading to poor quality of service • Mobile Number Portability • Plan to roll-out mobile number portability by middle of 2010 • The roll-out has been delayed for last two years due to operational readiness and security issues • Auction of 3G licenses • 3G auctions have been put off several times in last couple of years due to non-availability of spectrum and lack of consensus on the auction base price
Spectrum Allocation Plan • Known as 450 UHF MHz Band • Currently used for Police & Security networks Paired With • Known as 850 MHz band • Allocated to CDMA • Entire band available for mobile 890 902.5 915 935 947.5 960 450 470 698 862 824 844 869 889 • Known as 700 MHz band • Identified by WRC-07 for IMT • Entirely held by defense • Known as 900 MHz Band • Allocated GSM • All available spectrum allocated to mobile services Paired With
Spectrum Allocation Plan (cont’d) • Known as 1800 MHz band • Allocated to GSM • Up to 80% spectrum is with defense • Known as 2.1 GHz band • Allocated to WCDMA • Defense currently has bulk of spectrum and is expected to vacate some Paired With 1900 1910 1980 1990 1710 1785 1805 1880 1710 1785 1805 1880 • Known as US PCS band • CDMA operators have claimed this band but GSM operators oppose it due to interference • Defense has all the spectrum Paired With Paired With
Spectrum Allocation Plan (cont’d) • Known as 2.3 GHz TDD band • Intended allocation for BWA 2500 2690 2300 2400 • Known as 2.6 GHz band • Part intended allocation for BWA and part for mobile services • Currently entire band is with defense
Visit Telecom Circle to read interesting articles on Telecom and Internet http://www.telecomcircle.com To download India Subscriber Database – Circle-wise, operator-wise from year 2000 onwards Circle-wise ARPU data for GSM networks Case study on how Indian Carriers make 40% EBIDTA margins at 2 cents a minute Visit http://www.telecomcircle.com/2009/06/india-telecom/ Send your comments & feedback at mohit@telecomcircle.com