Download
1 / 36
360 likes | 723 Views
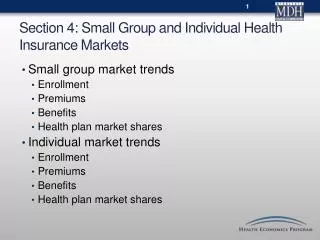
Section 4: Small Group and Individual Health Insurance Markets. Small group market trends Enrollment Premiums Benefits Health plan market shares Individual market trends Enrollment Premiums Benefits Health plan market shares. Small Group Market Trends.

E N D
Section 4: Small Group and Individual Health Insurance Markets • Small group market trends • Enrollment • Premiums • Benefits • Health plan market shares • Individual market trends • Enrollment • Premiums • Benefits • Health plan market shares
Trends in Minnesota Small Group Health Insurance Enrollment, 1997 to 2007 Note: Fully Insured market only. Source: MDH, Health Economics Program; estimates based on data from various sources.
Premium Increases in Minnesota’s Small Group Market, 1999 to 2007 Source: MDH, Health Economics Program; estimates based on data from various sources.
Per Person Annual Deductibles in the Small Group Market, 2002 to 2008 (by share of total enrollment) Source: MDH, Health Economics Program Median calculation excludes enrollees with no deductible
Distribution of Deductibles in the Small Group Market, 2002 to 2008 6.0% Source: MDH, Health Economics Program Deductible levels are per person. Distribution of deductibles only includes enrollment in plans with a deductible
Family Level Annual Deductibles in the Small Group Market, 2002 to 2008(by share of total enrollment) Source: MDH, Health Economics Program Median calculation excludes enrollees with no deductible
Distribution of Family Level Deductibles in the Small Group Market, 2002 to 2008 Source: MDH, Health Economics Program Deductible levels are per family. Distribution of deductibles only includes enrollment in plans with a deductible
Small Group Market Enrollment in High Deductible Health Plans with Savings Option, 2005 and 2008(by share of total enrollment) Qualified High Deductible Health Plan enrollment must meet the minimum deductible guidelines for the calendar year, as determined by the Internal Revenue Service (for 2008 the minimum deductible is $1,100), and be paired with (or have the option to pair with) a Health Savings Account. Source: MDH, Health Economics Program
Office Visit Cost Sharing Requirements in the Small Group Market, 2002 and 2008 (by share of total enrollment) Source: MDH, Health Economics Program
Distribution of Office Visit Copayments in the Small Group Market, 2002 to 2008(by share of enrollment) Source: MDH, Health Economics Program Includes only enrollees who have an office visit copayment.
Cost Sharing Requirements for Hospitalizations in the Small Group Market, 2002 to 2008 (by share of total enrollment) Source: MDH, Health Economics Program *Includes deductible only and copayment only
Per Person Out-of-Pocket Limits in the Small Group Market, 2002 to 2008(by share of total enrollment) Source: MDH, Health Economics Program Median calculation and distribution excludes enrollees with no out-of-pocket limit. Out-of-pocket limit applies to covered services only.
Family Level Out-of-Pocket Limits in the Small Group Market, 2002 to 2008(by share of total enrollment) Source: MDH, Health Economics Program Median calculation and distribution excludes enrollees with no out-of-pocket limit. Out-of-pocket limit applies to covered services only.
Prescription Drug Benefits in the Small Group Market, 2002 to 2008 • Virtually all enrollees in the small group market have some form of prescription drug coverage • Most enrollees were in plans that required copayments for prescription drugs • There was a shift in benefit design away from a fixed copayment towards tiered copayments
Prescription Drug Out-of-Pocket Limits in the Small Group Market, 2002 to 2008(by share of total enrollment) Source: MDH, Health Economics Program *General health plan out-of-pocket limits apply
Lifetime Limit on Benefits in the Small Group Market, 2002-2008(by share of total enrollment) Limits on lifetime benefits define the maximum amount an insurance policy will pay over the life of a policy holder. Source: MDH, Health Economics Program
Health Plan Market Shares: Small Group Market, 2007 Total Premium Volume in 2007: $1.53 Billion Note: Companies with common ownership were treated as one entity. For example, Blue Cross Blue Shield of MN includes Blue Cross Blue Shield of Minnesota and Blue Plus. Market shares based on premium volume; fully insured market only. Source: Minnesota Department of Commerce, "Report of 2007 Loss Ratio Experience in the Individual and Small Employer Health Plan Markets for: Insurance Companies Nonprofit Health Service Plan Corporations and Health Maintenance Organizations," June 2008.
Loss Ratio Experience in the Small Group Market, 1997 to 2007 Note: Companies with common ownership have been combined for purposes of this analysis. Source: Minnesota Department of Commerce loss ratio reports.
Trends in Minnesota Individual Market Enrollment, 1997 to 2007 Source: MDH, Health Economics Program; estimates based on data from various sources.
Premium Increases in Minnesota's Individual Market, 1999 to 2007 Sources: Minnesota Health Coverage Reinsurance Association (1999-2002) and Minnesota Department of Health (2003-2007)
Per Person Annual Deductibles in the Individual Market, 2002 to 2008 (by share of total enrollment) Source: MDH, Health Economics Program Median calculation excludes enrollees with no deductible. Category distribution excludes those in plans that are only available as family-only coverage and those in plans with a “per sickness” deductible.
Distribution of Deductibles in the Individual Market, 2002 to 2008 Source: MDH, Health Economics Program Deductible levels are per person. Distribution of deductibles only includes enrollment in plans with a deductible and excludes enrollment in plans with “per sickness” deductibles.
Family Level Annual Deductibles in the Individual Market, 2002 to 2008(by share of total enrollment) Source: MDH, Health Economics Program Median calculation excludes enrollees with no deductible. Category distribution excludes those in plans only available as self-only coverage and those with a “per sickness” deductible.
Distribution of Family Level Deductibles in the Individual Market, 2002 to 2008 Source: MDH, Health Economics Program Deductible levels are per family. Distribution of deductibles only includes enrollment in plans with a deductible.
Individual Market Enrollment in High Deductible Health Plans with Savings Option, 2005 and 2008(by share of total enrollment) Qualified High Deductible Health Plan enrollment must meet the minimum deductible guidelines for the calendar year, as determined by the Internal Revenue Service (for 2008 the minimum deductible is $1,100), and be paired with (or have the option to pair with) a Health Savings Account. Source: MDH, Health Economics Program
Office Visit Cost Sharing Requirements in the Individual Market, 2002 to 2008(by share of total enrollment) Source: MDH, Health Economics Program
Cost Sharing Requirements for Hospitalizations in the Individual Market, 2002 to 2008(by share of total enrollment) Source: MDH, Health Economics Program *Includes deductible only and coinsurance with limits per stay
Per Person Out-of-Pocket Limits in the Individual Market, 2002 to 2008(by share of total enrollment) Source: MDH, Health Economics Program Median calculation and distribution excludes enrollees with no out-of-pocket limit. Out-of-pocket limit applies to covered services only.
Family Level Out-of-Pocket Limits in the Individual Market, 2002 to 2008(by share of total enrollment) Source: MDH, Health Economics Program Median calculation and distribution excludes enrollees with no out-of-pocket limit. Out-of-pocket limit applies to covered services only.
Prescription Drug Benefits in the Individual Market, 2002 to 2008 (by share of total enrollment) Source: MDH, Health Economics Program
Prescription Drug Out-of-Pocket Limits in the Individual Market, 2002 to 2008(by share of total enrollment) Source: MDH, Health Economics Program *General health plan out-of-pocket limits apply
Lifetime Limit on Benefits in the Individual Market, 2002 to 2008(by share of total enrollment) Limits on lifetime benefits define the maximum amount an insurance policy will pay over the life of a policy holder. Source: MDH, Health Economics Program
Health Plan Market Shares: Individual Market, 2007 Total Premium Volume in 2007: $557 Million Note: Companies with common ownership were treated as one entity. Market shares based on premium volume; fully insured market only. Source: Minnesota Department of Commerce, "Report of 2007 Loss Ratio Experience in the Individual and Small Employer Health Plan Markets for: Insurance Companies Nonprofit Health Service Plan Corporations and Health Maintenance Organizations ," June 2008.
Loss Ratio Experience in the Individual Market, 1997 to 2007 Note: Companies with common ownership have been combined for purposes of this analysis. Source: Minnesota Department of Commerce loss ratio reports.