Download
1 / 36
360 likes | 459 Views
Validating Objective Measures of Physical Activity with a Novel Device. Phil Hurvitz UrbDP 598: Built Environment & Health January 22, 2008. Overview. Background Currently used devices: benefits and drawbacks A new device: the Multi-Sensor Board (MSB) Preliminary data. Conceptual Model.

E N D
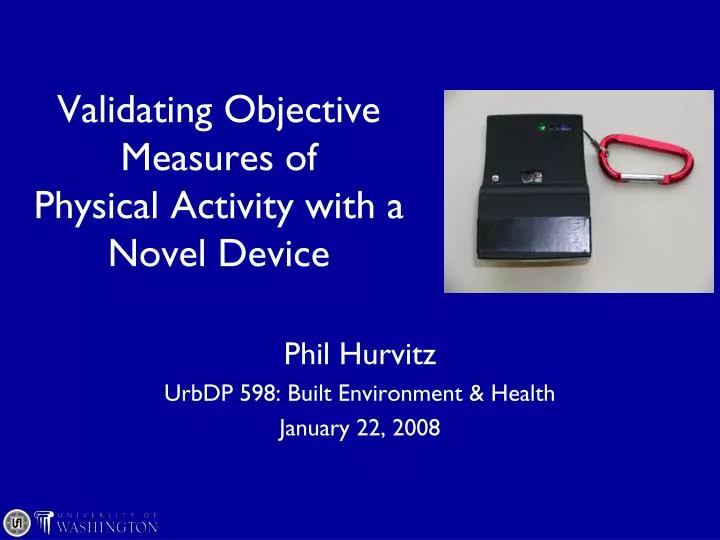
Validating Objective Measures ofPhysical Activity with a Novel Device Phil Hurvitz UrbDP 598: Built Environment & Health January 22, 2008
Overview • Background • Currently used devices: benefits and drawbacks • A new device: the Multi-Sensor Board (MSB) • Preliminary data Slide 2 (of 35)
Conceptual Model • Behav, Env > Health Outcome
High prevalence of no physical activity BRFSS: http://www.cdc.gov/brfss/ Slide 3 (of 35)
Increasing prevalence of obesity BRFSS: http://www.cdc.gov/brfss/ Slide 4 (of 35)
How did this happen? • Natural history of the human animal: we need physical activity (PA) to maintain a healthy body & mind • Modern conveniences have engineered PA out of our daily lives • Better to be fit & fat than thin & sedentary Slide 5 (of 35)
Modern conveniences “... the life of man, solitary, poor, nasty, brutish, and short. ” --Thomas Hobbes Slide 6 (of 35)
Modern conveniences Slide 7 (of 35)
A worldwide crisis? Slide 8 (of 35)
A worldwide crisis? Slide 9 (of 35)
Prevalence of Obesity Females age 15-100, 2005 WHO: http://www.who.int/en/ Slide 10 (of 35)
Prevalence of Obesity Males age 15-100, 2005 WHO: http://www.who.int/en/ Slide 11 (of 35)
Better to be fit & fat than thin & sedentary Sui X, LaMonte MJ, Laditka JN, Hardin JW, Chase N, Hooker SP, Blair SN. Cardiorespiratory fitness and adiposity as mortality predictors in older adults. JAMA. 2007 Dec 5;298(21):2507-16. Slide 12 (of 35)
Goal: increase physical activity • No apparent decrease in development and use of labor-saving devices • Will health agency guidelines “work” in the face of technological advances? • How will we know if there are changes in physical activity rates? • Current methods of measuring physical activity are not adequate! Slide 13 (of 35)
Current methods Slide 14 (of 35)
State-of-the-art: IDEEA • Intelligent Device for Energy Expenditure and Activity (IDEAA) • sensors attached to skin (cumbersome) • relative accelerometry of different body parts • no locational capability • no external environmental cues • $4,000 per unit Slide 15 (of 35)
State-of-the-art: MSB • Multi-Sensor Board • UW/Intel invention, recent development • single sensing unit with data logger (smart phone) • easily worn • measures multiple environmental data streams • obtains XY location data • estimated $100 per unit costin large manufacturing run Slide 16 (of 35)
Environmental data • Raw sensor data • Measurement frequency >200 Hzfor some variables Slide 17 (of 35)
Locational data • Real-time differentially corrected GPS • Ground accuracy: 3-7 m under typically good conditions • GPS data combined with MSB data • 1 s temporal resolution Slide 18 (of 35)
Data classification • Hidden Markov Model with Decision Stumps(a probabilistic data classification model based on multiple variables) Lester, J., Choudhury, T., Kern, N., Borriello, G., & Hannaford, B. (2005). A hybrid discriminative/generative approach for modeling human activities. Paper presented at the Nineteenth International Joint Conference on Artificial Intelligence (IJCAI). Slide 19 (of 35)
Data classification: pilot study precision = (true positive/(true positive + false positive)) recall = (true positive/(true positive + false negative)) Lester, J., Choudhury, T., Kern, N., Borriello, G., & Hannaford, B. (2005). A hybrid discriminative/generative approach for modeling human activities. Paper presented at the Nineteenth International Joint Conference on Artificial Intelligence (IJCAI). Slide 20 (of 35)
Data collection process • Environment measures • Subjects wear MSB on belt • MSB measures (8 variables) • GPS location • Continuous data sampling, 1Hz • Activity self-report • Subjects carry Windows Mobile phone • Hourly data sampling Slide 21 (of 35)
Activity self-report • Questionnaire administered on Smart Phone Slide 22 (of 35)
Activity self-report • Text message sent after questionnaire completed Slide 23 (of 35)
Activity self-report Slide 24 (of 35)
Preliminary data: location • 1 subject, 7 d, ~146,000 points Slide 25 (of 35)
Preliminary data: classification Slide 26 (of 35)
Research Question(s) • What build environment (BE) characteristics are associated with different activities? • Walking • Running • Pedal-cycling • Sitting • Driving Slide 27 (of 35)
Research Question(s) • What BE characteristics are associated with: • Walking trips < 1 mi • Driving trips < 1 mi • What is the size of an individual’s spatial extent of activity • All activity • Active modes of transport vs. Inactive modes • How does spatial extent vary across age, gender, wealth, BMI, BE of home &/or work location? Slide 28 (of 35)
Measuring built environment • What to measure? • Based on research question(s) • GIS data sources • Point locations • Buffer measures • Proximity measures • Where to measure? • Home-centered • Frank et al. 2005 • Moudon et al. 2005 • Where does activity take place in real time? Slide 29 (of 35)
Measuring built environment • Point-centered analysis of location • Any number of different data sets can be quantified • Enumeration & relative proportion of different land uses • Parcel density • Street-block size • Total length of sidewalk • Number of intersections, lighted crosswalks • Area and count of parks • Distance to different built environment features • We should quantify & analyze all locations that are experienced during the day, not only the home location • Work & school environments may be key determinants of physical activity Slide 30 (of 35)
Measuring built environment: land use Slide 31 (of 35)
Data reduction sampling strategy • Sampling strategy for data reduction without loss of variability 10% sample → 1.5 million data points (time or distance?) Slide 32 (of 35)
Challenges • Administrative challenges • Bugs • “Cutting edge” may sound super-cool, but it leads to “bleeding” • Validating a new method requires a big commitment • Interdisciplinarity has its ups & downs • The future of all complex research • Relying on others’ time & expertise • Working around another project’s timeline Slide 33 (of 35)
Challenges • Operational challenges • Lots of data to deal with 50 subjects * 7 d * 8 h/d * 60 m/h * 60 s/m = 10,080,000 observations 50 subjects * 8 h/d * 7 d * 1 survey/h = 2800 surveys Slide 34 (of 35)
Conclusion • Questions? • Interested in volunteering? http://tinyurl.com/3x2rkv http://gis.washington.edu/phurvitz/msb/ phurvitz@u.washington.edu Slide 35 (of 35)