Download
1 / 13
130 likes | 316 Views
Background: Commissions on the Status of Women. 1961, President Kennedy forms the 1st Presidential CommissionStates' Governors follow suit.Colleges and Universities

E N D
1. ADVANCE Indicators of the Status of Women in Academia Lisa M. Frehill
Executive Director,
Commission on Professionals in Science and Technology
2. Background: Commissions on the Status of Women 1961, President Kennedy forms the 1st Presidential Commission
States� Governors follow suit.
Colleges and Universities�various forms
President�s or Provost�s Commissions or Committees
Women�s Studies or Women�s Resource Centers form �grassroots� groups
Recent web search for NMSU�s newly-chartered CSW found 38 different colleges/universities with CSWs
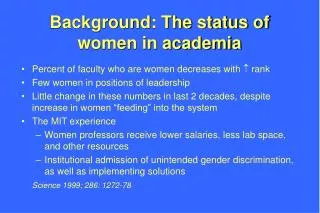
1999 MIT Committee Report
4. Fundamental Questions�Status of Women Faculty To what extent are departmental sex compositions �equitable�? To what extent are women and men in similar positions?
Are the institution�s processes of advancement fair to men and women?
To what extent do women hold powerful positions within the institution?
To what extent are resources allocated equitably by gender?
5. ADVANCE Indicators Working Group Pre-meeting: work in 2004 at NMSU ADVANCE to bring indicators together
January 2005: NSF in Arlington, VA
February 2005: UC, Irvine
June 2005: New Mexico State, Las Cruces
September 2005: UC, Irvine
6. 13 Individuals from 9 ADVANCE Projects Participated During 2005 with the Working Group New Mexico State University (L. Frehill & C. Jeser-Cannavale)
University of Alabama, Birmingham (H. Sviglin)
University of California, Irvine (P. Kehoe)
University of Michigan (A. Stewart, J.Malley, & E. Meader)
University of Puerto Rico, Humacao (E. Batiste)
University of Texas at El Paso (S. Gonzales-Baker)
Utah State University (K. Sullivan)
University of Wisconsin (J. Sheridan)
University of Washington (S. Edwards Lange)
National Science Foundation (A. Hogan)
7. To what extent are women and men in �gender equitable� departments and positions? Original Metrics:
1. Number and percent of women faculty in STEM
2. Number and percent of women in tenure line positions by rank and department
6. Number of women in STEM who are in non-tenure-track positions (teaching and research)
Report indicators for STEM and institution as a whole:
Number and percent of faculty by rank and tenure status by department
Measures that can be computed with the above: Indices of vertical and horizontal gender segregation: D, A, Representation Ratios, etc.
8. Are the institution�s processes of advancement fair to men and women? Original Metrics:
3. Tenure and promotion outcomes by gender
4. Years in rank by gender
5a. Time at institution
5b. Attrition by gender
8. Number of women STEM faculty in endowed/named chairs Report indicators for STEM and institution as a whole:
Likelihood of (by gender):
Tenure
Promotion Asst ? Assc
Promotion Assc ? Full
Average years at Associate rank for Full
Annual attrition: % of each sex within rank who leave the institution for any reason other than retirement
Number of women faculty in endowed/named chairs
9. To what extent do women hold powerful positions within the institution? Original Metrics:
2. Number and percent of women in tenure line positions by rank and department
7. Number and percent of women scientists and engineers in administrative positions
8. Number of women STEM faculty in endowed/named chairs
9. Number and percent of women STEM faculty on promotion and tenure committees
10. To what extent are resources allocated equitably by gender? Original Metrics
10. Salary of STEM faculty by gender (with additional controls such as department, rank, years in rank)
11. Space allocation of STEM faculty by gender (with additional controls such as department, etc.)
12. Start-up packages of newly hired STEM faculty by gender (with additional controls such as field/department,rank, etc.)
Instead of indicators, reports of rewards, resources, and responsibilities significant to faculty within the institution should be completed with some periodicity.
12. National Research Council Report �Gender Differences at Critical Transitions in the Careers of Science, Engineering and Mathematics Faculty.�
89 RI institutions and 6 disciplines:
Biology Chemistry
Mathematics Physics
Electrical engineering Civil engineering
Collected data basically related to the ADVANCE Indicators at individual and department levels.
NO DATA ABOUT RACE/ETHNICITY COLLECTED
Cross-sectional data � one moment in time (2004-05).
Women under-represented in initial applicant pools but those who DO get in
Receive similar resources as men within their disciplines
Have similar success in promotion and tenure within their disciplines
Do use stop-the-clock more often than men.
13. Key Issues Unit of analysis: discipline vs. with ADVANCE, institution.
Regression to the mean � obscures potential variations within institutions.
Institutional homogeneity/heterogeneity � top institutions are able to take �the best� and reward them.
Bias � no evidence there is no bias embedded in processes, indeed, this evidence suggests �Raising the bar� (see Moody) is still quite common.
14. Work In Progress Related to Indicators Frehill & Ivie, PAID:
Women of color � increasing visibility
Other sources of data
professional societies � Ivie and Frehill workshop 6/18/2009.
Which societies collect data?
What can we learn about women of color in academia?
Survey of Doctorate Recipients (longitudinal)
National Study of Postsecondary Faculty (cross-sectional, multi-year)
Cross-national / cross-disciplinary work in progress:
Measurement refinement � e.g., EU Glass Ceiling Index
Status of women in chemistry, computer science and mathematics (w/Willie Pearson, Jr, Georgia Tech).
Women�s international science collaborations (w/Kathrin Zippel, Northeastern U. ADVANCE Co-PI)