Download
1 / 34
340 likes | 344 Views
Mittal Steel South Africa Limited. Annual Financial Results for the 12 months ended December 2005. market & operations. Davinder Chugh. Overview. Record full year earnings of R5 079m Earnings per share of 1 139c up 12% Operating margin of 29% unchanged on 2004

E N D
Mittal Steel South Africa Limited Annual Financial Results for the 12 months ended December 2005
market & operations Davinder Chugh
Overview • Record full year earnings of R5 079m • Earnings per share of 1 139c up 12% • Operating margin of 29% unchanged on 2004 • Return on equity of 29% down from 32% • Higher average international steel prices • Cost increases contained • Liquid steel production up 3% • Safety remains priority • 13% reduction in injury rate • Delivering on R9bn capital investment programme Earnings up 12%
Key Result Drivers • 2005 vs 2004 • Increase in HRC US$ export price 4% • Increase in HRC Rand domestic price 4% • Total sales volume unchanged • Export sales volume up 17% • Slowdown in domestic sales volume (10%) • Increase in HRC Rand cash cost per tonne 11% • Labour productivity up 11% • Strengthening of ZAR 1% Strong export effort countered slowdown in domestic market
700 600 500 400 300 200 100 HRC Low carbon wire rod Export Prices Mittal Steel South Africa invoice prices (c&f) US$/t 1994 1995 1996 1997 1998 1999 2000 2001 2002 2003 2004 2005 Prices remained above historical trends, though off peak
Global Market Trends • Global steel supply outstripped demand in 2005 • Slackening demand in 2005 caused steel prices to fall • World economic growth is expected to remain positive at 4.3% according to the IMF • Global consolidation amongst steel companies continues • Steelmakers’ input costs remain high & will still increase in 2006, albeit at a lower rate • Chinese economy still growing at high rate, notwithstanding measures to cool down the economy (2005 = ±10%) • In 2005 China accounted for • 30.9% of world steel production • 30.1% of world steel consumption China continues to influence world markets
Import Export Chinese Market Trends • China a 3 million tonne net exporter of finished steel products in 2005 • This trend is likely to continue in 2006 • A small imbalance in the Chinese market can impact world markets Chinese import/export tonnes 1998 - 2005 Million tonnes China became net exporter in 2005
Chinese Market Trends • Chinese market saw substantial price reduction in Q2 and Q3 of 2005 • Strong recovery late in 2005 recouped a third of the loss • Price recovery expected • Prices dipped to below marginal cost • Inventory levels are low • Seasonal factors turn positive in the USA & EU • Chinese government to moderate the industry • Steel prices remained firm in the EU Chinese cost structure support higher steel prices
Chinese Cost Trends • China’s advantage of low labour cost is mitigated by: • Dependence on imported raw material • Inadequate iron ore reserves • Require imported good quality coking coal • Future capacity growth moderated by government policy & water shortage • Logistics constraints of port & rail capacity Overall high operating cost
350 300 250 200 150 100 50 Dec 01 Jun 02 Dec 02 Jun 03 Dec 03 Jun 04 Dec 04 Jun 05 Dec 05 Coking coal - Contract Iron ore fines - Contract Global Benchmark Price Based to 100 Margins under pressure due to increased input costs
Global Input Cost Trends • BF iron ore fines price for 2005 increased by 72% (higher increases for lump & pellets) • Metallurgical coking coal contracts for 2005/2006 settled at +120% • Scrap prices & freight rates stabilised during 2005, but still above historical trend • Diverging price trends for base metals & alloys • Zinc price increased by 58% in 2005 Raw materials continue to exert upward pressure on cost
Input Cost Positioning • Tonnes ‘000 • Backward integrated • Domestic supply agreements • Imported • Iron ore • 7 981 • 94% • - • 6% • DRI • 1 155 • 100% • - • - • Scrap (Purchase & Internal) • 1 858 • 60% • 40% • - • Coke (Metallurgical) • 2 157 • 99% • - • 1% • Coking coal (Metallurgical) • 2 866 • 12% • 22% • 66% • Coking coal (Market) • 709 • - • 100% • - • Other coal & anthracite • 2 122 • - • 100% • - Coal remains the biggest exposure
Iron ore Coal Scrap/DRI Alloys/Coating Refractories Other Input Cost Developments 2004 2005 Raw materials now constitute 44% of cash cost
Key Performance Indicators • 2004 • 2005 • CI savings (Rm) • 1 053 • 105 • Employees per mt produced • 1 698 • 1 487 • Revenue per head (R000) • 2 019 • 2 302 • HRC cash cost - R/t • 1 756 • 1 949 • - US$/t • 273 • 307 • Percentage value-add exports - flat • 83% • 94% • - long • 87% • 79% Continued efficiency & productivity improvement
2004 2005 Liquid Steel Production ‘000 tonnes Several production records at all plants
Domestic Export Sales Volumes 6230 6223 3166 3123 ‘000 tonnes 1947 1894 1160 1163 Vanderbijlpark Saldanha Long Products Total Inventory adjustment impacted on domestic sales
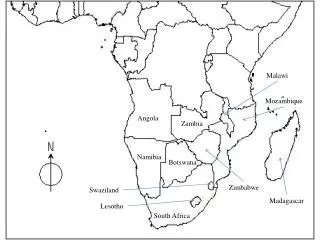
2004 2005 Mittal Steel South Africa - Geographic Sales Focus will remain on Africa
Steel sector demand Sector contribution to RSA Economic Growth (GDP) Revenue Drivers in Relation to the Economy Three sectors make up 70% of steel consumption
Safety Remains our Priority • Du Pont safety evaluation completed & safety improvement in progress • Four major units certified under OHSAS 18001 health & safety management system Disabling injuries per million man hours worked(employees & contractors) Disabling injury frequency rate (DIFR) Our safety record compares with global standards
Vanderbijlpark now a Zero Effluent Discharge FacilityWater treatment plant commissioned in December 2005 R222m
Investment Programme • Rm • Relines • 1 600 • Maintain capability • 930 • Galvanising line #5 • 100 • Automotive galv. line & other downstream projects • 1 200 • Coke strategy related • 620 • Other value adding • 937 • Completed in 2005 • 1 100 Expansion plans on track
Headline Earnings • Rm • 2004 • 2005 • Revenue • 23 053 • 24 032 • Comparable operating profit • 7 458 • 6 855 • Gains & losses on foreign exchange rate & financial instruments • (52) • 246 • Financing cost - net interest income • 31 • 169 • - imputed interest on non-current provisions • (170) • (140) • Income from investments • 5 • 5 • Tax • (2 465) • (2 329) • Equity earnings* • 258 • 275 • Minority interest • (6) • (2) • Comparable headline earnings • 5 059 • 5 079 • - in US$m • 807 • 794 • BAA remuneration* • (511) • Headline earnings • 4 548 • 5 079 * After tax Earnings up 12%
Comparable Headline Earnings Trend Rm 2005 2004 2003 Earnings remain healthy, though off previous highs
Operating Profit • Rm • 2004 • 2005 • Vanderbijlpark • 4 137 • 3 688 • Saldanha Steel • 1 173 • 785 • Long products • 1 783 • 2 100 • Coke & Chemicals • 462 • 301 • Other • 43 • 56 • Corporate • (140) • (75) • Comparable operating profit • 7 458 • 6 855 • BAA remuneration • (731) • Total • 6 727 • 6 855 Long products increased it’s contribution
Cash Flow • Rm • 2004 • 2005 • Cash profits from operations • 8 572 • 8 402 • Working capital • (1 410) • 20 • BAA remuneration • (731) • Capex • (1 254) • (1 568) • Net interest income • 31 • 168 • Investment income • 11 • 43 • Tax • (886) • (2 977) • Dividends • (339) • (2 853) • Net cash flow • 3 994 • 1 235 • Net cash • 3 973 • 5 160 Strong cash flow before tax & dividends
Financial Ratios • 2004 • 2005 • Operating margin • 29 • 29 - on comparative basis (%)* • 32 • 29 • EBITDA margin (%) • 33 • 33 - on comparative basis (%)* • 37 • 33 • Revenue/invested capital (times) • 1.5 • 1.5 • Return on equity (%) • 32 • 29 - on comparative basis (%)* • 35 • 29 • Net cash/equity (%) • 25.0 • 26.4 * Adjusted for once-off items Ratios support good investment case
300 250 200 Based to 100 150 100 50 2002 2003 2004 2005 Top 40 All Share Mittal Steel South Africa Source: McGregor BFA Share Performance Excellent medium term share performance
Dividend • Dividend policy • Distributing one third of headline earnings • Dividend declared • Interim dividend of 240 cents per share - 12 September 2005 • Final dividend of 140 cents per share - 20 March 2006 • Total dividend of 380 cents covered 3 times by EPS of 1 139 cents Dividend yield of 5.8%
Outlook for Q1’06 • Business environment • Local demand expected to improve • Stable international steel prices • Off-take to improve as inventory cycle completed • Higher input prices will influence production costs • Exchange rate will have an important influence • Earnings • Earnings to remain robust and in line with Q4’05, but exchange rate may have influence Continuous focus on cost control
Mittal Steel Company NV • Continue to reshape the global steel industry through consolidation • Revenues of almost US$30bn • Net profit US$3.4bn • #1 steel producer - Output at 69mtpa • Strong & strategic vertical integration • Potentially the first 100mtpa steel producer if Mittal & Arcelor combine: • Revenue US$70bn* • Net profit US$7.4bn* • Steel output at 115mtpa* *IBES estimates “Creating the most admired steel institution”
Mittal Steel South Africa Limited Annual Financial Results for the 12 months ended December 2005