Download
1 / 14
140 likes | 278 Views
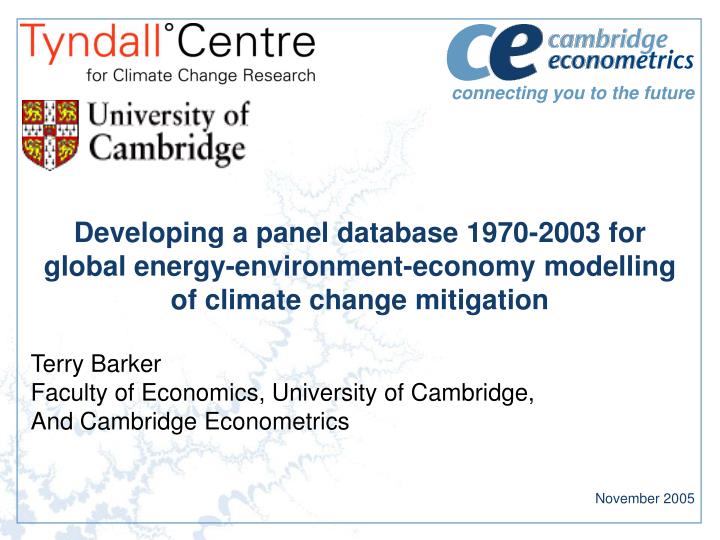
Developing a panel database 1970-2003 for global energy-environment-economy modelling of climate change mitigation. Terry Barker Faculty of Economics, University of Cambridge, And Cambridge Econometrics. November 2005. Outline. Context: global climate-change mitigation

E N D
Developing a panel database 1970-2003 for global energy-environment-economy modelling of climate change mitigation Terry Barker Faculty of Economics, University of Cambridge, And Cambridge Econometrics November 2005
Outline • Context: global climate-change mitigation • Use of data in the modelling • Data sources • Data quality • Conclusions
Global climate-change mitigation • IPCC: greenhouse gas emissions from human activity are likely to be responsible for climate change • Since the problem and solution are global and long-run, the modelling should • Distinguish the large single-country emitters (US, China) and those promising early action within a classification covering all countries • Focus on the dynamic aspects (long-run development) • The data set must cover energy, environment and economy (E3) variables in sectoral detail • Widespread use of energy, unevenly across sectors • fuels have different carbon contents • Many relevant technologies
damage to health and buildings ECONOMY as in national accounts e.g. industrial emissions of SF6 funding R&D TECHNOLOGY specifications & costs pollution- abatement equipment feedback prices and activity low-carbon processes & products energy-saving equipment etc ENVIRONMENTAL EMISSIONS as in environmental statistics ENERGY as in energy statistics fuel use Engineering-Energy-Environment-Economy statistics and interactions
Economic theory and data • Prevailing theory: neoclassical general equilibrium with use of Computable General Equilibrium (CGE) models • The practice of drawing parameter estimates from literature is ad hoc • which ones? short- or long-run estimates? • With same data and same parameters, different functional forms yield different policy outcomes (McKitrick, 1998) • Functional forms are chosen for tractability and stable unique solutions • Time-series data are generally ignored • Alternative theory: economic behaviour is institutional, with choices dominated by inertia and “satisficing” • Behaviour is highly place- and time-specific • Use of formal econometric techniques • Very data-intensive approach McKitrick, Ross R. (1998), ‘The econometric critique of applied general equilibrium modelling: the role of functional forms’, Economic Modelling, 15, pp. 543-573.
E3 model at the Global level (E3MG)features • Structural, econometric, dynamic, non-equilibrium, simulation E3 global model • projecting annually to 2020 and every 10 years to 2100 • 20 world regions, 21 energy users, 12 energy carriers, 41 industries, 14 atmospheric emissions,… • Use of time-series data 1971-2003 with cointegration techniques to identify long-run trends • Use of cross-section data • input-output tables for 2000 for industrial demands • bilateral trade flows for export and import weights • detailed emissions (various dates) for GHG and atmospheric pollutants (SO2, NOx, PM10)
Availability of energy data: IEA and US EIA • IEA Energy balances • Comprehensive coverage at broad level (power, industry, households, transportation) • Many gaps at a more detailed level • IEA Energy prices and taxes • Very partial data • US EIA • Easy to use • Full country coverage by geographical region • Secondary source
Availability of economic data • University of Purdue: GTAP (Global Trade Analysis Project) • Global trade model with a database that contains bilateral trade info for over 40 countries for 50 sectors, 2001 • OECD: STAN industry analysis • Main data source for OECD, covers many industrial variables, with detailed 2-digit level sectors, 1970-2003. • DG Economics and Finance: AMECO • Secondary data source, covers most world economic data, 1960-2006 • Main data source for macro variables (eg exchange rates). • World Bank: World Development Indicators (WDI) • Tertiary data source covers all countries and most economic data, some breakdowns, between 1960-2001. Secondary data source for macro variables (eg exchange and interest rates).
Availability of economic data:Conclusion:no suitable, up-to-date, global data base available • GTAP6 for general equilibrium models but • for one year (2001) • sectors suitable for studies of tariffs • regions suitable for trade not environmental analysis • quality for some regions and dates? • STAN for industry and R&D studies but • for OECD countries • selected (industrial) variables • no constant-priced trade data • AMECO for macroeconomic data but • EU focus • WDI comprehensive and incl. developing countries but • mainly aggregates • quality ?
Social Accounting Matrices (including input-output tables) • GTAP (Global Trade Analysis Project) • IO tablesfrom varying dates adjusted to 2001 • STAN • Consistent tables for 16 OECD countries, plus Brazil and China • From 1990s • EUROSTAT • Estimated tables for 2000 • EU MSs
Organising the data • “Original” data collected from primary sources (e.g. OECD) • Missing data interpolated from shares and totals • Processed for E3MG definitions, conventions and classifications • Stored as 2-dimensional matrices on several databanks • standard variable and parameter names • accessible by estimation and solution software • sector by year or sector by sector
Problems in constructing the database • comparability of data • across countries • over time • matching cross-section and time-series data • order of precedence of sources • quality of data • missing data • for former Soviet Union countries before 1990 • missing series, e.g. employees in India • gaps in series
Precedence for data sources • STAN is the default preferred choice for data • AMECO is preferred if no Stan-based matrix is available and for macro data: exchange and interest rates and taxes • Eurostat and national sources are required for consumption • WDI is used if nothing else is available
Conclusions • Massive exercise for a small research team • Very variable quality of data • deteriorates as they go back in time • and for countries as per capita incomes fall • Major problems with missing data • techniques developed to minimise errors of interpolation when totals available • not always possible e.g. former Soviet Union countries • However, even with these problems, using time-series integrated with cross-section data is better than using just one-year’s data • Urgently needed: improvements in coverage and quality • especially large emitting developing countries ie India • OECD STAN leading the way, but slow progress


![Toru Yamamori [University of Cambridge]](https://cdn1.slideserve.com/3537992/slide1-dt.jpg)