Download
1 / 29
290 likes | 295 Views
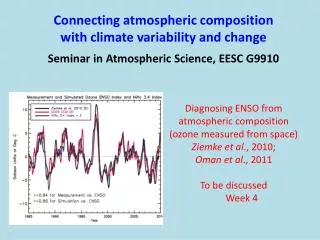
This article discusses the use of GOME 2 SCIAMACHY and OMI data at BIRA IASB for monitoring atmospheric composition and transport, with a focus on the exploitation of these data for ozone trends analysis, formaldehyde retrieval, and inversion of emissions.

E N D
Exploitation of GOME(-2), SCIAMACHY and OMI data for monitoring atmospheric composition and transport, at the Belgian Institute for Space Aeronomy(BIRA-IASB). M. De Mazière, I. De Smedt, B. Dils, J.C. Lambert, C. Lerot, J.F. Müller, G. Pinardi, T. Stavrakou, J. van Geffen, J. van Gent, M. Van Roozendael BIRA-IASB, Brussels, Belgium B. Mijling, R. van der A KNMI, Bilthoven, the Netherlands
GOME GOME-2 SCIA OMI SQWG Support to operational ground segment GDP4/ GDP5 GODFIT Scientific algorithms TEMIS/ PROMOTE Services TASTE Validation SCIAVALIG EVERGREEN Modelling/ Inverse PRODEX Overview Projects Activities
Support to operational ground segment Christophe Lerot, J. Van Gent, M. Van Roozendael, BIRA-IASB R. Spurr RT Solutions D. Loyola, P. Valks DLR
GODFIT/GDP4/GDP5 projects • Motivations: 1) Bring the accuracy of ESA total ozone instruments to the level reached by NASA instruments (TOMS, OMI) 2) Meet accuracy requirements needed for ozone trends analysis • Outcome: • GDOAS/ SDOAS: improved DOAS algorithms, currently used for operational ground segments for GOME, SCIAMACHY and GOME-2 (GDP4) • Ongoing: implementation of direct-fitting approach in operational environment for GOME, GOME-2 (GDP5)
Direct fitting approach provides improved consistency with OMI-TOMS GOME-OMI (%) as a fion of SZA 10 NH SH 0 -10 Direct fitting GDOAS
Tropospheric Formaldehyde (CH2O) from GOME and SCIAMACHY Isabelle De Smedt, M. Van Roozendael, BIRA-IASB R. Van Der A, H. Eskes KNMI
Why formaldehyde ? • CH2O is one of the most abundant carbonyl compounds and a central component of VOCs oxidation. It represents the total amount of oxidized VOC. Its observation can help to constrain VOCs emissions. • Sources: - Methane oxidation (background) - Biogenic VOCs oxidation (isoprene) - Anthropogenic hydrocarbon oxidation - Biomass burning (as first and secondary product) • Sinks : - Oxidation by OH radical and Photolysis - Major source of CO - Production of HO2 • Satellite observation of NO2 and CH2O support air quality control on a global scale. • Both NOx and VOC concentrations determine the production of ozone in the troposphere, a climate gas.
Satellite observations: retrieval • CH2O has a spectral signature of absorption in the near UV and can therefore be retrieved with the DOAS technique from satellite observations from GOME, SCIAMACHY, OMI, … • In particular, a new fitting window has been selected (328.5 – 346 nm) to achieve best consistency between data derived from GOME and SCIAMACHY GOME, Apr.1996 – Dec.2001 SCIA, Jan.2003 – Dec.2007
Validation of satellite retrievals • Measurement campaigns at St Denis, Ile de La Réunion (21°S), using ground-based MAXDOAS and FTIR measurements (2002, 2004, 2007) Aug. – Nov. 2004 • The day to day variations are well captured. • October 12: CH2O enhancement related to biomass burning in Madagascar and S. Africa. It is well correlated with enhancements observed in other FTIR gases like CO, C2H6, and has been confirmed by FLEXPART runs. FTIR retrievals of CH2O @ 2400-3310 cm-1; MAXDOAS retrievals of CH2O @ 336-358 nm. Courtesy: C.Vigouroux, M.De Mazière, F.Hendrick, M.Van Roozendael.
Satellite observations: continuity • The general agreement between both instruments allows the generation of a combined long-term time series of CH2O vertical columns covering a full decade from 1997 until 2007. • The quality and the consistency of the data are very important to be able to detect possible trends in emissions. • On the TEMIS/PROMOTE websites, you will find: • Daily, monthly and yearly maps for GOME and SCIAMACHY. • Data files with averaging kernels and error estimation for each satellite pixel. • The analysis of GOME-2 data will start within the next months. The global coverage in ≥1 day should allow to reduce the noise in the results.
10-year inversion of biogenic and pyrogenic NMVOC emissions based on GOME/SCIAMACHY CH2O columns and the adjoint model method Jean-François Müller, T. Stavrakou BIRA-IASB
Inversion methodology Prior emission distributions : base functions (one per grid cell, category and month) anthropogenic biomass burning biogenic Optimized emissions : fj are the emission parameters, which minimize the cost function: Model = IMAGES (v2) + adjoint A priori biomass burning emissions from GFED A priori biogenic isoprene emissions from MEGAN
Results for biogenic VOC: optimized/prior emission ratio Biogenic emission ratio for July 1997 when GFEDv1 is used factor of 2 decrease over the Eastern U.S. Large increase in Southern Africa, esp. over shrubland
Regions Annual trend (%/yr) Beijing area, China 11.8 Shanghai area, China 13.6 Wuhan area, China 6.6 Jinan area, China 9.5 Similar work for inversion of anthropogenic emissions of NOx Optimized / prior emission ratio for anthropogenic NOx (here, July 2000) Inferred anthropogenic emission trend 1997-2006, %/year
Conclusions • Multi-year emission inversions make it possible to estimate the interannual variability of the emissions (e.g. for biomass burning) and their long-term trends (for anthropogenic NOx) • Anthropogenic emission trends can be determined from 10-year NO2 dataset – caution is needed due to the indication of temporal drifts in the data • Biomass burning inventories can be evaluated and even improved based on HCHO retrievals
Support to Aviation Control Service (SACS) Jos Van Geffen, M. Van Roozendael BIRA-IASB Partners are KNMI, DLR and CGS.
Objectives of SACS • to deliver in near-real time data derived from satellite measurements regarding emissions of SO2 (from measurements by SCIAMACHY, OMI and GOME-2) and aerosols (from SEVIRI) possibly related to volcanic eruptions, and where possible to track volcanic plumes. • The Volcanic Ash Advisory Centres (VAACs) are the official organisations to gather information on volcanic ash clouds and on the basis of that issue advice and alerts to air line and air traffic control organisations on the possible danger of volcanic clouds for aviation. Notifications of “exceptional SO2 concentrations” and data from SACS can assist the VAACs with their task: to assess volcanic activity and if necessary to issue alerts to air traffic control and airline organisations. • Though SACS is primarily directed at volcanic emission, it also provides information on SO2 related to anthropogenic activities.
Example of volcanic SO2 On 6 Feb. 2008 the Tungurahua volcano in Ecuador erupted. Ash emissions reached 15 km altitude south of the volcano, and 9 km altitude 225 km NW of the volcano. Tungurahua (summit: 5 km) lies some 130 km south of the town Quito. The eruptions killed five people and made about 20.000 hectare of agricultural ground infertile. Several thousand people were evacuated. Tungurahua has been active since 1999, when it erupted for the first time in 80 years. On 6 Feb.SACS sent out an alert of an “exceptional SO2 concentration” based on SCIAMACHY data. AFP, 15/07/2006
Example of volcanic SO2 Tungurahua volcano, Ecuador: long = -78.44 , lat = -1.47
Long-range transport of NOX Bart Dils, J. Van Geffen, M. De Mazière, M. Van Roozendael BIRA-IASB Bas Mijling, R. van der A, R. Dirksen KNMI
Motivation • Predominant westerly winds transport air pollutants from East US to West Europe Basic mechanism for LRT: rapid uplifting followed by fast horizontal transport • OMI thanks to its daily global coverage and high spatial resolution can easily track pollution plumes of NO2 • FLEXPART (A. Stohl et al.) is a Lagrangian particle dispersion model, used to fill in the gaps, to add value to the observations, and to confirm the transport events. East Asian outflowof tropospheric NO2observed by OMI26 May 2007
Flexpart, 7 March 2007 OMI, 7 March 2007 TEMIS LRT Service: example • Daily monitoring of transatlantic transport events of tropospheric NO2 (above the clouds) at http://www.temis.nl/lrt
NOX = 2 days NOX(T) Perspectives • At present, the comparisons between the observations and the FLEXPART simulations focus on the spatial distribution of the NO2 field, not on the quantitative values (cf. uncertainty on half-lifetime of NOx). FLEXPART, 7 March 2007 OMI, 7 March 2007 NOX = 2 days • Improvements are in progress: quantitative and statistical evaluations; forecasts.
Overall conclusions • New (e.g., H2CO) and improved (e.g., O3) data products have been retrieved from GOME-like satellite observations. • The global satellite data products (NO2, H2CO, CO,…) are used to derive top-down improved emission inventories. • The continuity and consistency of the data series allows the determination of interannual variability, long-term trends, … • Scientific services have been built, e.g., SACS, Long-range transport, … : they need high spatial resolution and temporal coverage; they would benefit from additional observations throughout the day. • Characterisation and Validation of the data products and the associated services is a continuously going on activity.
Our interests • Extension of GOME – SCIA – OMI – GOME-2 timeseries • Depending on the choice of the orbit: • additional complementarity in time of the day • Improved possibilities for coincidences with companion satellites for calibration / validation • Extension of time series of SCIA NIR observations of greenhouse gases CH4 and CO (indirect GHG), complementary to IASI • Daily global coverage with higher spatial resolution → for observation of regional features, for better capture of volcanic plumes, transport, … • Transport of CO could be monitored similar to NO2
Our interests • Higher SNR for higher precision of data products → stronger constraints in inverse modelling • Requires good accuracy of radiance calibration; better performances of the optics (e.g., diffusor plate exempt of spectral features, stray light correction, …) • Need for appropriate pre-orbit and in-orbit characterisation of instrument performances
Looking forward to TROPOMI…. Thank you