Download
1 / 75
780 likes | 1.1k Views
The International HapMap Project: A Rich Resource of Genetic Information. Julia Krushkal. Lecture in Bioinformatics. 04/15/2010. The International HapMap Project.

E N D
The International HapMap Project: A Rich Resource of Genetic Information Julia Krushkal Lecture in Bioinformatics 04/15/2010
The International HapMap Project “…Determine the common patterns of DNA sequence variation in the human genome, by characterizing sequence variants, their frequencies, and correlations between them, in DNA samples from populations with ancestry from parts of Africa, Asia and Europe.” Nature (2003) • Population-specific sequence variation • Allele frequencies • Linkage disequilibrium patterns • Haplotype information • Tag SNPs • Structural genome variation • Better understanding of human population dynamics and of the history of human populations • Cell lines available from Coriell Inst. for Medical Research • A rich resource for biomedical genetic analysis
HapMap Population Samples Project launched in 2002 to provide a public resource for accelerating medical genetic research • 270 Individuals from 4 Geographically Diverse Populations • YRI: 90 Yorubans from Ibadan, Nigeria • 30 parent-offspring trios • CEU: 90 northern and western European-descent living in Utah, USA from the Centre d’Etude du Polymorphisme Humain (CEPH) collection • 30 parent-offspring trios • CHB: 45 unrelated Han Chinese from Beijing,China • JPT: 45 unrelated Japanese from Tokyo, Japan Combined in many analyses http://www.hapmap.org/ HapMap http://www.genome.gov/page.cfm?pageID=10001688 NHGRI
International HapMap Project Papers • The Int. HapMap Consortium. A second generation human haplotype map of over 3.1 million SNPs.Nature 449, 851-861. 2007 • The Int. HapMap Consortium.A Haplotype Map of the Human Genome. Nature 437:1299-1320.2005 • The Int. HapMap Consortium. The International HapMap Project.Nature 426, 789-796.. 2003 • The Int. HapMap Consortium. Integrating Ethics and Science in the International HapMap Project. Nature Reviews Genet 5, 467 -475. 2004 • Thorisson et al. The International HapMap Project Web site.Genome Res 15:1591-1593. 2005 • HapMap-related papers • Sabeti et al. Genome-wide detection and characterization of positive selection in human populations. Nature 449, 913-918. 2007. • Clark et al. Ascertainment bias in studies of human genome-wide polymorphism. Genome Res, 15:1496-1502. 2005 • Clayton et al. Population structure, differential bias and genomic control in a large-scale, case-control association study. Nature Genet 37(11):1243-1246. 2005 • de Bakker et al. Efficiency and power in genetic association studies. Nature Genet 37:1217-1223. 2005 • Goldstein, Cavalleri. Genomics: Understanding human diversity. Nature 437:1241-1242. 2005. • Hinds et al. Whole genome patterns of common DNA variation in three human populations. Science 307:1072-1079. 2005. • Myers et al. A fine-scale map of recombination rates and hotspots across the human genome. Science, 310:321-324. 2005 • Nielsen et al. Genomic scans for selective sweeps using SNP data.Genome Res 15:1566-1575. 2005 • Smith et al. Sequence features in regions of weak and strong linkage disequilibrium. Genome Res 15: 1519-1534. 2005 • Weir et al. Measures of human population structure show heterogeneity among genomic regions.Genome Res 15: 1468-1476. 2005.
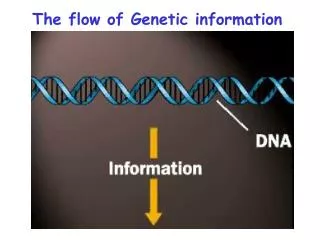
Human Chromosomes • Contain DNA • 22 pairs of autosomes + • sex-chromosomes (X and Y) + mitochondrial genome • Contain functional units (genes) and other DNA Human genome sequence is available as a reference, as a result of the Human Genome Project A significant amount of inter-individual variation exists
Chromosomes are sets of continuously linked genetic loci Example: Integrated map of chromosome 5 from the International HapMap Project, http://www.hapmap.org
GeneticVariation • Some DNA loci vary among individuals • Linked genetic loci are inherited non-independently • Loci may change with time (mutation, selection, genetic drift) • Some DNA changes lead to quantitative changes in RNA expression and to quantitative or qualitative changes in protein production • Some genetic changes, even small, may lead to disease • A large amount of natural variation occurs in healthy individuals, i.e., • many changes are neutral • Loci genetically linked to the disease-causing locus can be used as genetic markers to search for the disease locus SNP1 SNP2 There are many types of DNA variation, e.g. Sequence variation AAAC/TGGCTA Microsatellite repeats …AATG AATGAATGAATG…
Polymorphic Site A locus with common DNA variation 2 alleles in a population Shows difference in DNA sequence among individuals In most definitions: the most common allele with frequency < 99%, or minor allele frequency (MAF) 1%, or MAF 2%, or at least two alleles have frequencies 1%. A rare allele that occurs in <1% of the population is usually non considered a polymorphic site. 90%of sequence variation among individuals is due to common variation (MAF 1%, ); 10% are rare variants Not all disease-predisposing variants are common
SNP=Single Nucleotide Polymorphism A SNP locus on the distal end of the long arm of human chromosome 5 (data from Ensembl) SNP locus rs6870660 http://www.ensembl.org CAAATTCCATG[A or C]AGAAGGAAATACAT A and C are alleles at SNP locusrs6870660
A SNP locus on the distal end of the long arm of chromosome 5 SNP locus rs6870660 http://www.hapmap.org
Hardy-Weinberg Equilibrium 2 alleles, A and B frequencies p and qp+q=1 The allele frequencies remain constant through time. Sperm Egg F1 Under Hardy-Weinberg equilibrium, the relative genotype frequencies are: F1: (p+q)2 PAA=p2 PAB=2pq PBB =q2 In autosomal genes, and in absence of disturbing influences, this proportion is maintained through all subsequent generations. Departures can be characterized by disequilibrium
Linkage Disequilibrium Associations among alleles at different loci A1 B1 D = Linkage disequilibrium coefficient Coefficient of association A2 B2 D=pA1B1-pA1pB1 Locus A Locus B Normalized disequilibrium coefficient Squared Correlation coefficient Also ranges from 0 to 1 1 – absolute or perfect linkage; 0.8 is the cutoff often used D’=D/|D|max |D| max = | min(pA1pB2, pA2pB1)| -1 D’ 1 r2 =D2/(pA1pA2pB1pB2) Extended to multiallelic markers
Regulatory Interactions: The ENCODE Project <> 2003-Pilot project launched (1% of the genome) 2007- Pilot project completed; production phase launched on the entire genome High-through-put experimental and computational approaches to studies of DNA regulatory sites, regulatory interactions, and DNA modification Production Scale Effort Pilot Scale Effort Data Coordination Center Technology Development Effort
Genome SNP Variation Size of human genome 3.2 109 bp 99.9% identical 9-10 mln SNPs may have MAF 5% 30,000 genes HapMap SNP Density Coverage • Phase I (published in 2005) • 931,340 SNPs passed quality control • 1 SNP / 3000 bp • 11,500 nsSNP • 10 ENCODE regions, 500 kb each • 17,944 SNPs • 1 SNP / 279 bp • Phase II (published in 2007) Consensus data set: • 3,107,620 SNPs, QC+ in all panels, polymorphic in 1 panel • 1 SNP / 875bp • 25-30% of all SNPs with MAF 5% The cumulative # of non-redundant SNPs is shown as a solid line, the # of SNPs validated by genotyping as a dotted line, and double-hit status as a dashed line.
HapMap Phase II • 21,177 SNPs from Phase I that had ambiguous position or other low reliability feature were not included in Phase II • Chimpanzee, rhesus macaque used for comparisons and to infer ancestral states of SNPs • 3,107,620 SNPs, QC+ in all panels, polymorphic in 1 panel • 1 SNP / 875bp 1.14 SNP/kb • 25-30% of all SNPs with MAF 5% • 98.6% of the genome is within 5 kb of the nearest polymorphic SNP • Better representation of rare variation/ SNPs with MAF 1% • Phase II marker data capture overwhelming majority of genome SNP variation, mean r2 of 0.9-0.96 for different populations
SNP Differences among Individuals Far Exceed Differences among Populations Phase 1: Autosomes: Across the 1 million SNPs genotyped, only 11 have fixed differences between CEU and YRI, 21 between CEU and CHB/JPT, and 5 between YRI and CHB/JPT. X chromosome 123 SNPs were completely differentiated between YRI and CHB/JPT, but only 2 between CEU and YRI and 1 between CEU and CHB/JPT.
Importance of Understanding Patterns of Human Genetic Variation • Without knowing the patterns of correlation, one would need to analyze millions of SNPs and other polymorphisms in the genome • Alleles at nearby loci occur non-independently • Knowledge about correlations among polymorphisms allows to us significantly reduce the number of genetic tests, while surveying extensively for variation patterns • Patterns of correlation are complex • Need to know local patters of genetic variation rather than simply use SNPs at regular intervals
Haplotype Maps of the Human Genome Genome regions decomposed into discrete haplotype blocks, which capture similarity in haplotype organization Patil et al. 2001, Blocks of Limited Haplotype Diversity Revealed by High-Resolution Scanning of Human Chromosome 21. Science 294(5547):1719-23
Haplotype Maps Generated by The International HapMap Project
Haplotype Maps of the Human Genome Helmuth 2001, Science 293:583-585 Find correlations among groups of SNPs Haplotypes were inferred for the HapMap project from trios data and from unrelated individuals using Phase (Stephens 01; Stephens and Donnely 03)
Haplotype Block Partition Results for Three Populations 1,586,383 (SNPs) genotyped in 71 Americans of European, African, and Asian ancestry Population Blocks Average size, kb* Required SNPs African-American 235,663 8.8 570,886 European-American 109,913 20.7 275,960 Han Chinese 89,994 25.2 220,809 * Average distance spanned by segregating sites in each block. Minimum number of SNPs required to distinguish common haplotype patterns with frequencies of 5% or higher. Hinds et al. 2005 Science
Extended LD bin and haplotype block structure around the CFTR gene. LD bins, where each bin has at least one SNP with r2 > 0.8 with every other SNP, are depicted as light horizontal bars, with the positions of constituent SNPs indicated by vertical tick marks as well as the extreme ends of the bars. Isolated SNPs are indicated by plain tick marks. Haplotype blocks, within which at least 80% of observed haplotypes could be grouped into common patterns with frequencies of at least 5%, are depicted as dark horizontal bars. Unlike haplotype blocks that are by design sequential and nonoverlapping, SNPs in one LD bin can be interdigitated with SNPs in multiple other overlapping bins Hinds et al 2005 Population differences in local bin structure Differences in allele and haplotype frequencies “Although analysis panels are characterized both by different haplotype frequencies and, to some extent, different combinations of alleles, both common and rare haplotypes are often shared across populations” (The Int. HapMap Project, Nature, 2005)
Amount of Captured Sequence Variation in HapMap Phase II For common variants (MAF 0.05) the mean maximum r2 of any SNP to a typed one is 0.90 in YRI, 0.96 in CEU and 0.95 in CHB/JPT. 1.09 million SNPs capture all common Phase II SNPs with r2 0.8 in YRI. Very common SNPs with MAF 0.25 are captured extremely well (mean maximum r2 of 0.93 in YRI to 0.97 in CEU) Rarer SNPs with MAF<0.05 are less well covered (mean maximum r2 of 0.74 in CHB/JPT to 0.76 in YRI).
Amount of Captured Sequence Variation in HapMap Phase II Additional tag SNPs are unlikely to capture large groups of additional SNPs Can use to phase new data using HapMap haplotype information, missing data imputation
DNA Chips and Resequencing: High-through-put Analysis of Sequence Variation An easy way to access genome-wide variation Both Affymetrix and Illumina DNA chips contain representative SNP and CNV probes Affymetrix GeneChip 6.0: 1.8 million markers for genetic variation, including 906,000 SNPs and 946,000 copy number probes. Illumina 1M Bead Chip and 1M-duo Bead Chip: ~950,000 genome-spanning tag SNPs; ~100,000 additional non-HapMap SNPs, >565,000 SNPs in and near coding regions such as nsSNPs, promoter regions, 3’ and 5’ UTRs; dense coverage in ADME and MHC regions. ~260,000 markers located in novel and reported copy number polymorphic regions. Sequenom mass arrays (based on Maldi-TOF)
Common Ancestry and Segmental Sharing Relatedness High Med Low Homozygocity
Recombination Hotspots 32,996 recombination hotspots 60% of genome recombination, 6% sequence
Recombination and tagSNPs • Recombination hotspots are frequently insufficient to break down allelic associations • Common haplotypes often span recombination hotspots • 0.5-1% of SNPs are untaggable: no SNPs with r2 0.2 within 100 kb • Untaggable SNPs are not in segmental duplications • They often are in recombination hotspots; some may be due to genealogical structure, mutation hotspots, or gene conversion
Demographic History of Human Populations Genealogical History and Allelic Associations The genealogy for the 13 haplotypes observed in a 40-kb region of Chromosome 1 (between SNPs rs12085605 and rs932087) where there is no evidence for recombination. Location of polymorphic mutations is indicated by circles. Relative frequency of each haplotype in the sample from each of the three panels (with white indicating 0% and black indicating 100%). The dotted line in the genealogy indicates a branch of the tree that is not present in the CEU sample and whose removal results in perfect association between SNPs rs12085824 and rs11205476. Can track genealogical history Complex patterns of stochastic mutation, recombination, selection, genetic drift in evolutionary history shape the patterns of genome variation McVean et al., 2005. PLoS Genetics 1:e54
HapMap 3 FUNDING AGENCIES National Institutes of Health – National Human Genome Research Institute (NHGRI) Wellcome Trust Mirrors at Sanger Center and Baylor College of Medicine
QC in HapMap 3 • Hardy-Weinberg p>0.000001 (per population) • missingness <0.05 (per population) • <3 Mendel errors (per population; only applies to YRI, CEU, ASW, MEX, MKK) • SNP must have a rsID and map to a unique genomic location • The "consensus" data set contains data for 1115 individuals (558 males, 557 females; 924 founders and 191 non-founders), only keeping SNPs that passed QC in all populations (overall call rate is 0.998). The "consensus|polymorphic" data set has 35023 monomorphic SNPs (across the entire data set) removed.
Data Content SNP GENOTYPE DATA label # samples # QC+ SNPs # polymorphic QC+ SNPs ASW 71 1632186 1536247 CEU 162 1634020 1403896 CHB 82 1637672 1311113 CHD 70 1619203 1270600 GIH 83 1631060 1391578 JPT 82 1637610 1272736 LWK 83 1631688 1507520 MEX 71 1614892 1430334 MKK 171 1621427 1525239 TSI 77 1629957 1393925 YRI 163 1634666 1484416 consensus 1115 1525445 1490422
PCR RESEQUENCING DATA • “The sequence-based variant calls were generated by tiling with PCR primer sets spaced approximately 800 bases apart across the ENCODE 3 regions. Following filtering low-quality reads the data were analyzed with SNP Detector version 3, for polymorphic site discovery and individual genotype calling. Various QC filters were then applied. Specifically, we filtered out PCR amplicons with too many SNPs, and SNPs with discordant allele calls in mutliple amplicons. “ • Also filtered out were SNPs with low completeness in samples, or with too many conflicting genotype calls in two different strands. • “In the QC+ data set, …filtered out samples which had low completeness, and filtered out SNPs with low call rate in each population (<80%) and not in HWE (p<0.001). In the QC+ data set, the overall false positive rate is ~3.2%, based on a limited number of validation assays.” http://www.broadinstitute.org/~debakker/p3.html
Data Content PCR RESEQUENCING DATA label number of samples ASW 55 CEU 119 CHB 90 CHD 30 GIH 60 JPT 91 LWK 60 MEX 27 MKK 0 TSI 60 YRI 120 total 712
HapMap Project is a Unique Resource for Genome-Wide Association Studies • Resource for selection of representative tag SNPs from low diversity haplotype blocks or from highly correlated SNPs • Tag SNPs with r2 0.8 chosen for popular SNP chips • Resource for selecting custom SNPs for dense genotyping in candidate regions, determined from genetic pathways of the 1st stage of multistage GWAS • LD and haplotype information utilized for missing SNP imputation for genotypic problems or in meta-analyses
http://www.genome.gov/26525384 As of 04/15/10, this table includes 543 publications and 2658 SNPs.
Published Genome-Wide Associations through 6/2009, 439 published GWA at p < 5 x 10⁻⁸ NHGRI GWA Catalog www.genome.gov/GWAStudies