Download
1 / 20
200 likes | 359 Views
Outlook for shale gas and tight oil development in the U.S. for IFRI March 14, 2013 | Paris, France by Adam Sieminski, Administrator. Annual Energy Outlook 2013 projections to 2040. Growth in energy production outstrips consumption growth

E N D
Outlook for shale gas and tight oil development in the U.S. for IFRI March 14, 2013 | Paris, France by Adam Sieminski, Administrator
Annual Energy Outlook 2013 projections to 2040 • Growth in energy production outstrips consumption growth • Crude oil production rises sharply over the next decade • Motor gasoline consumption reflects more stringent fuel economy standards • The U.S. becomes a net exporter of natural gas in the early 2020s • U.S. energy-related carbon dioxide emissions remain below their 2005 level through 2040 Adam Sieminski , IFRI March 14, 2013
U.S. energy use grows slowly over the projection reflecting improving energy efficiency and slow, extended economic recovery Source: EIA, Annual Energy Outlook 2013 Early Release U.S. primary energy consumption quadrillion Btu Shares of total U.S. energy History Projections 2000 2011 28% Natural gas 24% 26% 11% 6% 8% Renewables (excluding liquid biofuels) 8% 9% 8% Nuclear 2% 1% 23% Liquid biofuels 19% 20% Coal 39% 36% 32% Oil and other liquids Adam Sieminski , IFRI March 14, 2013
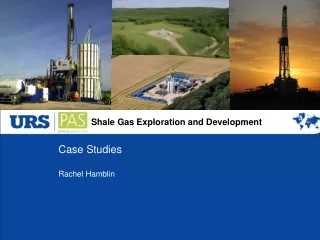
U.S. Shale Gas Adam Sieminski , IFRI March 14, 2013
An average well in shale gas and other continuous resource plays can also have steep decline curves, which require continued drilling to grow production million cubic feet per year Source: EIA, Annual Energy Outlook 2012 1 Adam Sieminski , IFRI March 14, 2013
For example: Oil production by monthly vintage of wells in the Williston Basin Source: DrillingInfo history through August 2012, EIA Short-Term Energy Outlook, February 2013 forecast Adam Sieminski , IFRI March 14, 2013
Domestic production of shale gas has grown dramatically over the past few years shale gas production (dry) billion cubic feet per day Sources: LCI Energy Insight gross withdrawal estimates as of January 2013 and converted to dry production estimates with EIA-calculated average gross-to-dry shrinkage factors by state and/or shale play. Adam Sieminski , IFRI March 14, 2013
Shale gas leads growth in total gas production through 2040 U.S. dry natural gas production trillion cubic feet Source: EIA, Annual Energy Outlook 2013 Early Release History Projections 2011 Shale gas Tight gas Non-associated offshore Alaska Coalbed methane Associated with oil Non-associated onshore Adam Sieminski , IFRI March 14, 2013
Natural gas consumption is quite dispersed with electric power, industrial, and transportation use driving future demand growth U.S. dry gas consumption trillion cubic feet Source: EIA, Annual Energy Outlook 2013 Early Release History Projections *Includes combined heat-and-power and lease and plant fuel. **Includes pipeline fuel. Electric power 32% 31% Industrial* 33% 33% 2% Gas to liquids 6% 3% Transportation** 13% 12% Commercial 19% 14% Residential Adam Sieminski , IFRI March 14, 2013
Growth of natural gas in transportation led by heavy duty trucks (LNG) and gas to liquids (diesel)… marine and rail to come? U.S. natural gas consumption quadrillion Btu Note: Gas to liquids includes heat, power, and losses. Source: EIA, Annual Energy Outlook 2013 Early Release History Projections 2011 28% Gas to liquids Freight trucks 38% 1% 3% Buses 1% 1% Light-duty vehicles 3% Pipeline fuel 31% 95% Adam Sieminski , IFRI March 14, 2013
Total natural gas exports nearly quadruple by 2040 in the AEO2013 Reference case U.S. natural gas exports trillion cubic feet Source: EIA, Annual Energy Outlook 2013 Early Release Exports to Mexico Exports to Canada Lower 48 LNG exports Alaska LNG exports Adam Sieminski , IFRI March 14, 2013
Domestic natural gas production grows faster than consumption and the U.S. becomes a net exporter of natural gas around 2020 U.S. dry gas trillion cubic feet Source: EIA, Annual Energy Outlook 2013 Early Release 2011 History Projections Consumption Domestic supply Net imports Adam Sieminski , IFRI March 14, 2013
U.S. Tight Oil Adam Sieminski , IFRI March 14, 2013
Domestic production of tight oil has grown dramatically over the past few years tight oil production for select plays million barrels per day Source: Drilling Info (formerly HPDI), Texas RRC, North Dakota department of mineral resources, and EIA, through October 2012. Adam Sieminski , IFRI March 14, 2013
U.S. tight oil production leads a growth in domestic production of 2.6 million barrels per day between 2008 and 2019 U.S. crude oil production million barrels per day Source: EIA, Annual Energy Outlook 2013 Early Release and Short-Term Energy Outlook, February 2013 2011 History Projections STEO Feb. 2013 U.S. crude oil projection Tight oil Other lower 48 onshore Lower 48 offshore Alaska Adam Sieminski , IFRI March 14, 2013
U.S. petroleum product exports exceeded imports in 2011 for first time in over six decades annual U.S. net exports of total petroleum products, 1949 – 2011 million barrels per day Source: EIA, Petroleum Supply Monthly net product exporter Adam Sieminski , IFRI March 14, 2013
U.S. dependence on imported liquids depends on both supply and demand U.S. liquid fuel supply million barrels per day Source: EIA, Annual Energy Outlook 2013 Early Release History Projections 2011 2005 Consumption 37% 45% 60% Net imports Domestic supply Adam Sieminski , IFRI March 14, 2013
Light-duty vehicle liquids consumption is lower primarily due to more stringent CAFE standards light-duty vehicle liquids consumption million barrels per day Source: EIA, Annual Energy Outlook 2013 Early Release AEO2012 AEO2013 Adam Sieminski , IFRI March 14, 2013
Global tight oil production comparisons IEO2013 DRAFT BP Energy Outlook 2030 million barrels per day Source: Preliminary International Energy Outlook 2013, BP Energy Outlook 2030 Adam Sieminski , IFRI March 14, 2013
For more information U.S. Energy Information Administration home page | www.eia.gov Annual Energy Outlook | www.eia.gov/forecasts/aeo Short-Term Energy Outlook | www.eia.gov/forecasts/steo International Energy Outlook | www.eia.gov/forecasts/ieo Today In Energy | www.eia.gov/todayinenergy Monthly Energy Review | www.eia.gov/totalenergy/data/monthly Annual Energy Review | www.eia.gov/totalenergy/data/annual Adam Sieminski , IFRI March 14, 2013