Download
1 / 35
350 likes | 485 Views
Hawai‘i Public School Teachers Survey. Prepared for: The Learning Coalition February 2012. Ward Research, Inc. • 828 Fort Street, Suite 210 • Honolulu, Hawaii 96813 • Phone: (808) 522-5123 • Fax: (808) 522-5127. Table of Contents. Page. Executive Highlights.

E N D
Hawai‘i Public SchoolTeachers Survey Prepared for: The Learning Coalition February 2012 Ward Research, Inc. • 828 Fort Street, Suite 210 • Honolulu, Hawaii 96813 • Phone: (808) 522-5123 • Fax: (808) 522-5127
Table of Contents Page
Executive Highlights The following section highlights key findings from a quantitative telephone survey among n=317 Hawai‘i public school teachers, K-12, who work full-time for the Department of Education. A total sample of n=317 teachers completed the survey between December 1, 2011 to February 7, 2012. Maximum sampling error for a sample of n=317 is +/- 5.4%. • Teacher Satisfaction • Overall, those public school teachers surveyed displayed generally high levels of satisfaction with their career choice and a positive outlook toward their long-term aspirations in the profession. • One-fourth of the respondents indicated that their level of satisfaction with their career choice is better than in previous years (26%); 2 in 5 said that it was the same (42%); and 3 in 10 said that it was worse than in previous years (29%). • A slight majority said that they “definitely will be” teaching 3 to 5 years from now (57%), while an additional one-fourth indicated that they “probably will be” teaching (28%). • One in 7 teachers surveyed indicated that they were unlikely to still be teaching 3 to 5 years from now (14%); most saying that they were planning to retire by that time and others voicing reasons of general dissatisfaction. • Nearly all of those surveyed (99%) agreed that they are proud to be a teacher, with 4 in 5 strongly agreeing (79%) with the statement. • Support Network and Work Environment • Overall, those public school teachers surveyed also gave high satisfaction ratings to most aspects of their support network and work environment. • Smaller class size and more planning time with fellow teachers were differentiated by survey respondents as changes which would have the most impact on their effectiveness as teachers. • Higher compensation and greater public respect for teaching as a profession received the highest ratings as changes which would have the most impact on job satisfaction.
Executive Highlights -- cont. • Principal’s Strategic Vision • A large majority of teachers are on board with their principal’s strategic vision (85% agree; 37% “strongly agree”). • Four in 5 respondents had either a better understanding of their principal’s strategic vision (33%) or the same interpretation of it (48%). However, one-fifth indicated being less clear of their principal’s vision compared to previous years (8%) or were not able to communicate a rating at this time (11%). • About HSTA • While over half (62%) agreed that HSTA leadership reflects their views and priorities, over one third (38%) disagreed with the statement – 13% strongly so. • Roughly one-third of those surveyed (34%) feel that they do not get enough support from HSTA. • Outlook Among Newer Teachers • The outlook among newer teachers --- less than 5 years with DOE --- is very positive, with a large majority saying that they either “definitely will be” (68%) or “probably will be” (24%) teaching 3 to 5 years from now. • Newer teachers were more supportive of their principal’s strategic vision than were long-time teachers.
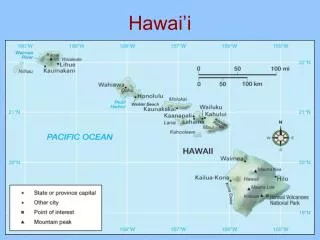
Objectives • The primary objectives of the research were: • TO ASSIST THE LEARNING COALITION IN BETTER UNDERSTANDING THE CURRENT WORK ENVIRONMENT AMONG HAWAI‘I PUBLIC SCHOOL TEACHERS AND TO GAUGE THEIR LIKELIHOOD OF EMBRACING/OPPOSING CHANGE. • TO DETERMINE ANY DIFFERENCES IN TEACHER ATTITUDES AND PERCEPTIONS BASED ON KEY DEMOGRAPHIC SEGMENTS.
Methodology In order to meet the objectives, a telephone survey of n=317 Hawai‘i public school teachers employed full-time by the Department of Education was conducted between December 1, 2011 and February 7, 2012. Maximum sampling error for the total sample of n=317 is +/- 5.4%. A list of K-12 public school teachers was purchased from a database company. The list contained home phone numbers of n=669 teachers and home addresses of n=5,772 teachers (with no phone numbers). Ward Research appended the list with listed telephone numbers and augmented the sample with contact information from teachers listed in our own internal databases. This sample was used in calling, with a target of however many completions could be reached within a total of 365 interviewing hours. The survey instrument was created by Ward Research, with input and approval from The Learning Coalition. All interviewing was conducted from the Ward Research Calling Center in the downtown Honolulu office. Interviews were conducted between the hours of 5:00 p.m. and 9:00 p.m. on week nights and 9:00 a.m. to 9:00 p.m. on weekends. The Calling Center is equipped with a Computer Assisted Telephone Interviewing (CATI) system which allows for the 100% monitoring of calls, through a combination of electronic and observational means. The final datafile was weighted, as followed, based on years of service with the DOE.
Figure 1: Profile of Respondents: Years A Teacher With Hawai‘i Department of Education Base: (317)
Figure 2: Profile of Respondents: School Meeting AYP Base: (317)
Figure 3: Satisfaction With Career Choice Q: Is your satisfaction with your career choice…? (Base: 317) • One-fourth of those public school teachers surveyed indicated that their level of satisfaction with their career choice is better than in previous years (26%), while 2 in 5 said that their satisfaction was about the same (42%). Three in 10 voiced declining sentiment toward their career choice (29%).
Satisfaction With Career Choice (Additional Findings) Among those more likely than others to be displaying reservations about their career choice (worse than in previous years) included: • Long-time teachers who have been teaching with the Hawai‘i Department of Education for over 10 years (41%), versus newer teachers of less than 5 years (16%); • Those who disagree that HSTA leadership reflects their views and priorities (40%), as opposed to those who tend to agree with the statement (23%); • Those from upper-income households of $100,000+ (40%), as compared to those from lower-income households of less than $50,000 (19%); and • Neighbor Island public school teachers (39%), versus O‘ahu public school teachers (25%).
Figure 4: Likely To Still Be Teaching 3-5 Years From Now Q: How likely are you to be teaching 3-5 years from now? (Base: 317) • A slight majority of respondents said that they definitely will be teaching 3 to 5 years from now (57%), while an additional one-fourth indicated that they probably will be teaching (28%). One in 7 public school teachers surveyed indicated that they were unlikely to still be teaching at that time (14%).
Likely To Still Be Teaching 3-5 Years From Now (Additional Findings) • The outlook among newer teachers --- less than 5 years with the Hawai‘i Department of Education --- is very positive. A large majority (92%) indicated that they either definitely will be (68%) or probably will be (24%) teaching 3 to 5 years from now. • Based on the 14% segment who indicated that they definitely will not or probably will not be teaching 3 to 5 years from now, the most frequently mentioned reasons were “planning to retire” (61%), and general dissatisfaction (19%).
Figure 5: Proud To Be A Teacher Q: Do you agree/disagree – I am proud to be a teacher? (Base: 317) • Nearly all of those public school teachers surveyed agreed that they are proud to be a teacher (99%), with 4 in 5 strongly agreeing (79%) with the statement.
Proud To Be A Teacher (Additional Findings) Among those more likely than others to say that they “strongly agree” that they are proud to be a teacher were: • Those from schools not meeting AYP (85%), versus those from schools that are meeting AYP (70%); • Those who see themselves definitely teaching 3 to 5 years from now (89%), as compared to those who probably will/will not be teaching at that time (65%); • Those who agree that HSTA leadership reflects their views and priorities (84%), as opposed to those who do not agree (70%); • Those from smaller households of one or two people (86%), versus those from three or four person households (72%); • Those from lower-income households (87%), as compared to those from upper-income households (67%); and • Neighbor Island teachers (87%), as opposed to O‘ahu teachers (75%).
Figure 6: HSTA Leadership Reflects My Views and Priorities Q: Do you agree/disagree – HSTA leadership reflects my views and priorities? (Base: 317) • There was less solidarity among those surveyed in the feeling that HSTA leadership reflects their views and priorities.
As shown in the figure on the following page, those surveyed expressed high levels of satisfaction across all aspects of their teaching profession --- with the highest satisfaction levels reported in the relationship they have with fellow teachers at their school. Overall Satisfaction With Aspects Of Teaching Profession Those public school teachers surveyed were asked to think about various aspects of being a teacher and to rate their overall satisfaction with each one. They were read the following list and asked if they were very satisfied, somewhat satisfied, somewhat dissatisfied, or very dissatisfied with each aspect: • Your career choice to be a public school teacher; • Your principal; • The relationship you have with fellow teachers in your school; and • The relationship you have with parents and students’ care takers.
Figure 7: Overall Satisfaction With Aspects Of Teaching Profession DISSATISFIED SATISFIED 97% 4% 9% 91% 12% 88% 17% 82% 80% 60% 40% 20% 0% 20% 40% 60% 80% 100% Very dissatisfied somewhat dissatisfied Very satisfied somewhat satisfied
Figure 8: Teaching Environment At Your School • When asked to describe the teaching environment at their school (based on a scale where 0 = “complete isolation” and 10 = “full collaboration with your peers as a team”), those public school teachers surveyed gave a fairly high mean rating of 7.32. [Note: Please see Table 13 in the Detailed Findings section of this report for full distribution information.] • None gave a rating of “0”, while 1 in 10 gave a rating of “10” (10%). • Among those giving significantly higher ratings were: • Those who say that their level of satisfaction with their career choice is better than it was in previous years (7.68), versus those who say it is worse than in previous years (6.60); • Those who “definitely will be” teaching 3 to 5 years from now (7.73), as compared to those who “probably will”/ “will not” be teaching at that time (6.75); • Those who agree that HSTA leadership reflects their views and priorities (7.62), as opposed to those who disagree (6.79); and • Those from upper-income (7.52) and middle-income (7.47) households, versus those from lower-income households (6.82). Mean Rating
Rating Their Support Network Those public school teachers surveyed were asked to rate the various components of their support network using a scale of very supportive, moderately supportive, improving but not supportive enough, or unsupportive. The following were rated: • Your principal; • Fellow teachers; • Your union; and • Parents. • As shown in the figure on the following page, those surveyed gave relatively high ratings to the support they receive from their fellow teachers and from their principal. • Roughly one-third of the respondents feel that they do not garner enough support from parents or from HSTA.
Figure 9: Rating Their Support Network 10% 90% 19% 80% 66% 33% 61% 34% 80% 60% 40% 20% 0% 20% 40% 60% 80% 100% Unsupportive Improving but not supportive enough Very supportive Moderately supportive
Overall, 6 in 7 public school teachers said that they currently ask parents or caregivers to support their instructional goals for their children outside of school (86%). Of this segment, half say that they communicate with parents or caregivers on a weekly basis (52%), while more than one-third have monthly contact with parents or caregivers (36%). Figure 10: Support Outside of School Q: Do you currently ask parents or caregivers to support your instructional goals for their children outside of school? (Base: n=317) Q: On average, how often do you communicate with parents or caregivers about your instructional goals for their children? (Base: n=273 teachers who said “yes” or “sometimes”)
Changes Having Most Impact On Effectiveness As A Teacher Those surveyed were asked to think about what changes could have the most impact on their effectiveness as a teacher. They were read the following list and asked to rate each one based on a scale of 0 to 10, with 0 meaning “no impact at all” and 10 being “a tremendous amount of impact”: • More timely feedback from your principal; • Better and more timely data on how your students are doing in the classroom; • Smaller class size; • More instructional time with your students; • A more flexible bell schedule; and • More planning time with your fellow teachers.
Figure 11: Changes Having Most Impact On Effectiveness As A Teacher Mean Ratings Based on a scale with 0=no impact at all and 10=is a tremendous impact (Base: 317) [Note: Please see Tables 20 to 25 in the Detailed Findings section of this report for more detail.] • Of those factors tested, public school teachers rated smaller class size (8.82) and more planning time with your fellow teachers (8.29) as having the most impact on their effectiveness as a teacher. Better and more timely data on how students are doing in the classroom (7.50) and more instructional time with students (7.49) ranked on a second tier, while more timely feedback from Principal (6.33) and more flexible bell schedule (5.65) were considered relatively less impactful. It should also be noted, that there were no significant differences in general ratings based on demographic segments.
Changes Having Most Impact On Job Satisfaction Those teachers surveyed were asked to think about what changes could have the most impact on their job satisfaction. They were read the following list and asked to rate each one on a scale of 0 to 10, with 0 meaning “no impact at all” and 10 being “a tremendous amount of impact”: • Greater public respect for teaching as a profession; • More professional development; • A more collaborative culture within your school; • Stronger instructional leadership within your school; and • Higher compensation.
Figure 12: Changes Having Most Impact On Job Satisfaction Based on a scale with 0=no impact at all and 10=is a tremendous impact (Base: 317) [Note: Please see Tables 28 to 32 in the Detailed Findings section of this report for more detail.] Mean Ratings • Public school teachers rated all factors tested as being relatively impactful on their job satisfaction, with higher compensation (8.78) ranking atop the list. Greater public respect for teaching as a profession (8.43) ranked second, followed by a more collaborative culture within the school (8.06), more professional development (7.53), and stronger instructional leadership within the school (7.46). It should also be noted, that there were no significant differences in general ratings based on demographic segments.
Figure 13: Agree/Disagree With Principal’s Strategic Vision Q: Thinking of the current school year, please tell me whether you agree or disagree with your principal’s strategic vision. (Base: 317) • A large majority of those public school teachers surveyed are on board with their principal’s strategic vision (85% agree; 37% “strongly agree”). In contrast, 1 in 7 respondents indicated that they disagree with their principal’s strategic vision (15%; 4% “strongly disagree”).
Agree/Disagree With Principal’s Strategic Vision (Additional Findings) Among those more likely to agree with their Principal’s strategic vision were: Note: It should also be noted that, contrary to some previous findings, there were no significant differences detected when comparing O‘ahu (84%) versus Neighbor Island (85%) teachers. • Newer teachers of less than 5 years (90%), versus long-time teachers of more than 10 years (78%); • Those who agree that HSTA leadership reflects their views and priorities (90%), as compared to those who disagree with this statement (74%); and • Those who say they will definitely be teaching 3 to 5 years from now (90%), as opposed to those who probably will/will not be teaching at that time (78%).
Figure 14: Understanding Your Principal’s Strategic Vision Q: Do you feel your understanding of your principal’s strategic vision is…? (Base: 317) • One-third of those surveyed feel that they have a better understanding of their principal’s strategic vision than in previous years (33%), while half said that they have the same interpretation of it (48%). One-fifth indicated that they were less clear of their principal’s vision compared to previous years (8%) or were not able to provide a rating at this time (11%).