Download
1 / 13
130 likes | 236 Views
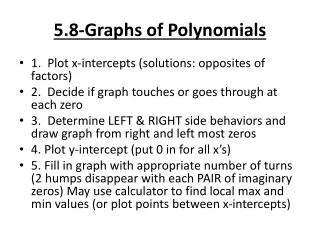
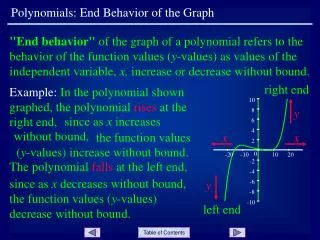
Graphs of Polynomials and End Behaviors. Learning Targets. Determine the general shape of its graph based on the equation of the function Determine the end behavior of graphs based on their factors and degrees Labeling the end behavior appropriately. 9-1 Team Activity.

E N D
Learning Targets • Determine the general shape of its graph based on the equation of the function • Determine the end behavior of graphs based on their factors and degrees • Labeling the end behavior appropriately
9-1 Team Activity • Work in your teams on this problem • Take the first five minutes to silently look at the example graphs and note the differences and similarities of each • After the silent pondering period talk about what you noticed and see if you can come up with a graph that models the “roller coaster” shown. • Teams will be called on to offer up information that they found useful when trying to determine the equation
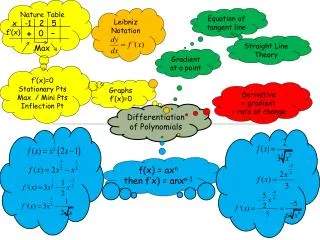
Importance of Degrees • The degrees of each term tell us a lot about the polynomial and how it behaves • The highest degree is linked to the end behavior
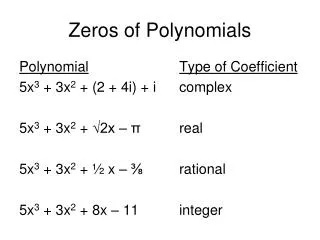
Finding the Leading Terms Degree • In order to find the highest degree we can add up all of the factors exponents. • This sum will always result in the highest degree of the leading term • Using this information we can determine how a graph will behave as x approaches and
Practice • Sketch the following polynomials: • 1) • 2) • 3)
#1 This is only a sketch
#2 This is only a sketch
#3 This is only a sketch
9-2 Activity • In your groups you will split up the eight equations and each person will look and come up with connections or patterns that they notice between the equations and their graphs. • We will then start on a more formal activity after 10 minutes
Activity: Polynomial Posters • Each person is responsible to come up with a poster that shows two graphs that make connections from what we learned today • Each group will then switch and look at each others posters and make notes at what they noticed or wondered, each team will then be required to share their two biggest takeaways
For tonight: • Worksheet: I will collect this on Monday