Download
1 / 2
20 likes | 160 Views
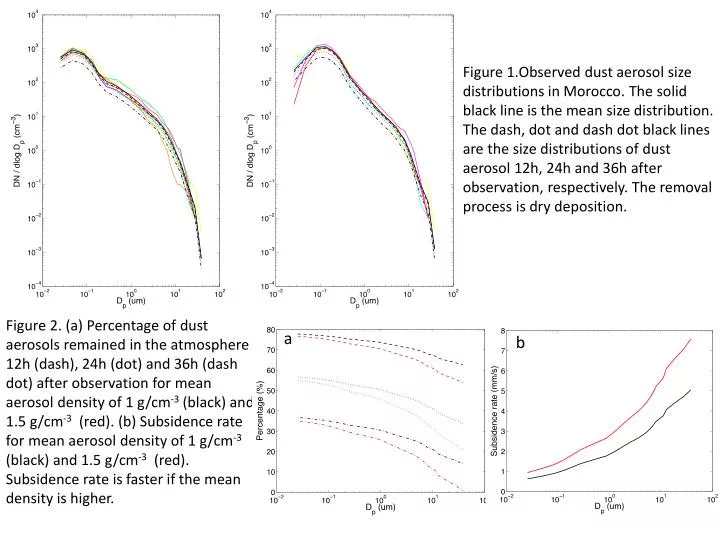
Figure 1.Observed dust aerosol size distributions in Morocco. The solid black line is the mean size distribution. The dash, dot and dash dot black lines are the size distributions of dust aerosol 12h, 24h and 36h after observation, respectively. The removal process is dry deposition. .

E N D
Figure 1.Observed dust aerosol size distributions in Morocco. The solid black line is the mean size distribution. The dash, dot and dash dot black lines are the size distributions of dust aerosol 12h, 24h and 36h after observation, respectively. The removal process is dry deposition. Figure 2. (a) Percentage of dust aerosols remained in the atmosphere 12h (dash), 24h (dot) and 36h (dash dot) after observation for mean aerosol density of 1 g/cm-3 (black) and 1.5 g/cm-3 (red). (b) Subsidence rate for mean aerosol density of 1 g/cm-3 (black) and 1.5 g/cm-3 (red). Subsidence rate is faster if the mean density is higher. a b
Table 1. The mean effective diameter of dust aerosols and the percentage remaining in the atmosphere12h, 24h and 36h after observation assuming no size dependence. Figure 3. The red circle, green square and blue diamond represent the percentage of aerosol remaining in the atmosphere 12h, 24h and 36h after observation, respectively, assuming no size dependence and the mean aerosol density of 1 g/cm-3. Otherwise description is the same as figure 2.